
Page 354 - Fiber Bragg Gratings
P. 354
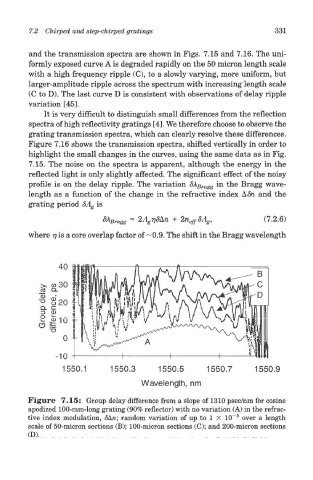
7.2 Chirped and step-chirped gratings                           331

         and the transmission spectra are shown in Figs. 7.15 and 7.16. The uni-
         formly exposed curve A is degraded rapidly on the 50 micron length scale
         with a high frequency ripple (C), to a slowly varying, more uniform, but
         larger-amplitude ripple across the spectrum with increasing length scale
         (C to D). The last curve D is consistent with observations of delay ripple
         variation [45].
             It is very difficult to distinguish small differences from the reflection
         spectra of high reflectivity gratings [4]. We therefore choose to observe the
         grating transmission spectra, which can clearly resolve these differences.
         Figure 7.16 shows the transmission spectra, shifted vertically in order to
         highlight the small changes in the curves, using the same data as in Fig.
         7.15. The noise on the spectra is apparent, although the energy in the
         reflected light is only slightly affected. The significant effect of the noisy
         profile is on the delay ripple. The variation 8X Bragg in the Bragg wave-
         length as a function of the change in the refractive index kdn and the
         grating period 8A g is


         where 77 is a core overlap factor of—0.9. The shift in the Bragg wavelength


        Figure 7.15: Group delay difference from a slope of 1310 psec/nm for cosine
         apodized 100-mm-long grating (90% reflector) with no variation (A) in the refrac-
                                                               5
        tive index modulation, <5An; random variation of up to 1 X 10~  over a length
         scale of 50-micron sections (B); 100-micron sections (C); and 200-micron sections
        (D).