
Page 122 - Fluid-Structure Interactions Slender Structure and Axial Flow (Volume 1)
P. 122
1 04 SLENDER STRUCTURES AND AXIAL FLOW
et al. 1985, 1986) pressurization effects were not considered, by making the downstream
end of the pipe free to slide axially [6 = 0 in equations (3.37) and (3.38)].
Long’s (1955) experiments involved simply-supported and clamped-clamped steel
pipes conveying fluid; the downstream end was mounted on rollers. The simply-supported
pipe had outer diameter Do = 25.4mm (1 in), wall thickness h = 0.94mm (0.037 in),
and span L = 3.048m (120in). Despite the length and hence relatively large flexibility
of this pipe, Ucd = n corresponds to Ucd 2: 52 m/s (172ft/s) - a high and difficult to
achieve flow-rate, because of the pumping requirements implied: a high flow rate at a
high pressure (to overcome the large pressure drop); indeed, beyond the capabilities of
Long’s apparatus. By means of strain gauges, Long measured the first-mode frequency and
damping, and how they varied with u.+ It should be recalled that %e(Ql) is expected to
decrease parabolically with u; also, since 9nt(s21) is approximately constant according to
theory, 61 2 2nC1 = 2n9m(Q1)/%e(O1) is expected to increase parabolically. However,
for u < 1, both d[%e(Ql)]/du and d&/du are small, and for the urnax 2: 0.68 achieved in
these experiments the effect, if any, was judged to be within the margin of experimental
error.* Hence, these experiments were largely inconclusive.
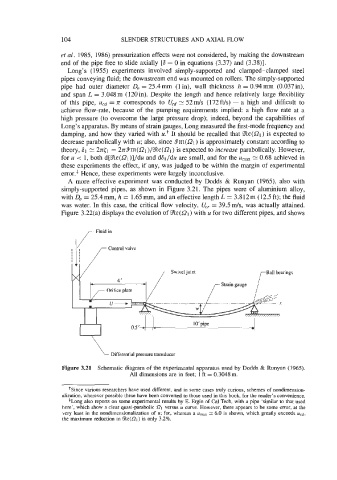
A more effective experiment was conducted by Dodds & Runyan (1965), also with
simply-supported pipes, as shown in Figure 3.21. The pipes were of aluminium alloy,
with 0, = 25.4mm, h = 1.65 mm, and an effective length L = 3.812m (12.5ft); the fluid
was water. In this case, the critical flow velocity, U,, = 39.5m/s, was actually attained.
Figure 3.22(a) displays the evolution of %e(Q1) with u for two different pipes, and shows
Differential pressure transducer
Figure 3.21 Schematic diagram of the experimental apparatus used by Dodds & Runyan (1965).
All dimensions are in feet; 1 ft = 0.3048 m.
+Since various researchers have used different, and in some cases truly curious, schemes of nondimension-
alization, wherever possible these have been converted to those used in this book, for the reader’s convenience.
*Long also reports on some experimental results by E. Ergin of Cal Tech, with a pipe ‘similar to that used
here’, which show a clear quasi-parabolic Q1 versus u curve. However, there appears to be some error, at the
very least in the nondimensionalization of u; for, whereas a urnax E 6.0 is shown, which greatly exceeds U,d,
the maximum reduction in %e(Q) is only 3.2%.