
Page 97 - Instant notes
P. 97
Acid-base titrations 83
When the stoichiometry (or ratio of number of moles) of acid and base in the solution
is such that exact neutralization occurs (acid and base have reacted to produce a salt
solution), for example:
H 2CO 3(aq)+2NaOH (aq)→Na 2CO 3(aq)+2H 2O (aq)
this is called the stoichiometric point, or the equivalence point, or the end point of the
titration. If the stoichiometry of the reaction is unknown, this can then be calculated from
the volumes and concentrations of the titrant and analyte solutions at the end point (as
this gives the number of moles of analyte and titrant, see Topic D1).
For a strong acid-strong base titration, for example:
both the strong acid and the strong base are completely dissociated and so the reaction is
−
−
+
+
simply H 3O (aq)+OH (aq)→2H 2O (1), with the other ions, Na and Cl , taking no part in the
reaction. At the end point, the solution is neutral (pH=7). If the acid is the analyte and the
base is the titrant, the pH curve starts at a low pH and rises sharply through the end point
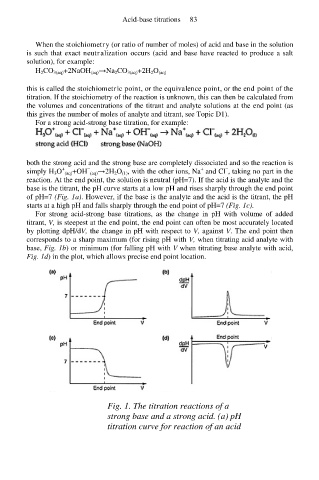
of pH=7 (Fig. 1a). However, if the base is the analyte and the acid is the titrant, the pH
starts at a high pH and falls sharply through the end point of pH=7 (Fig. 1c).
For strong acid-strong base titrations, as the change in pH with volume of added
titrant, V, is steepest at the end point, the end point can often be most accurately located
by plotting dpH/dV, the change in pH with respect to V, against V. The end point then
corresponds to a sharp maximum (for rising pH with V, when titrating acid analyte with
base, Fig. 1b) or minimum (for falling pH with V when titrating base analyte with acid,
Fig. 1d) in the plot, which allows precise end point location.
Fig. 1. The titration reactions of a
strong base and a strong acid. (a) pH
titration curve for reaction of an acid