
Page 98 - Instant notes
P. 98
Physical Chemistry 84
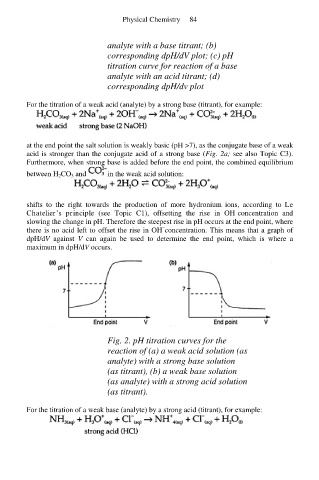
analyte with a base titrant; (b)
corresponding dpH/dV plot; (c) pH
titration curve for reaction of a base
analyte with an acid titrant; (d)
corresponding dpH/dv plot
For the titration of a weak acid (analyte) by a strong base (titrant), for example:
at the end point the salt solution is weakly basic (pH >7), as the conjugate base of a weak
acid is stronger than the conjugate acid of a strong base (Fig. 2a; see also Topic C3).
Furthermore, when strong base is added before the end point, the combined equilibrium
between H 2CO 3 and in the weak acid solution:
shifts to the right towards the production of more hydronium ions, according to Le
−
Chatelier’s principle (see Topic C1), offsetting the rise in OH concentration and
slowing the change in pH. Therefore the steepest rise in pH occurs at the end point, where
−
there is no acid left to offset the rise in OH concentration. This means that a graph of
dpH/dV against V can again be used to determine the end point, which is where a
maximum in dpH/dV occurs.
Fig. 2. pH titration curves for the
reaction of (a) a weak acid solution (as
analyte) with a strong base solution
(as titrant), (b) a weak base solution
(as analyte) with a strong acid solution
(as titrant).
For the titration of a weak base (analyte) by a strong acid (titrant), for example: