
Page 513 - Forensic Structural Engineering Handbook
P. 513
14.4 MATERIAL-SPECIFIC FORENSIC ANALYSES
Establishing Design Values. Traditionally the basic allowable stress design (ASD) val-
ues for lumber and timbers have been determined per the clear-wood procedure. Small,
clear, straight-grained specimens of a given species are tested in bending, tension parallel
to grain and compression parallel to grain in sufficient quantity for statistical analysis. A
series of factors are then applied which include adjustment for size effect, moisture content,
safety factor, a strength ratio between the value for clear wood and the grade for which a
basic allowable stress is desired, and other adjustment factors where applicable.
Basic allowable stress design values for larger solid sawn timbers are still established
using the clear-wood procedure. Following an extensive testing program, allowable design
values for dimension lumber (nominal 2 to 4 in thickness) are now established by the in-
grade procedure. This program consisted of more than 70,000 pieces of full-sized lumber
from production runs tested in bending, tension and compression parallel to grain, and
allowable design properties subsequently determined per American Society for Testing and
Materials (ASTM) procedures.
This large data set was used to develop a model to assign design values for North
American dimension lumber. Tabular stresses resulting from the in-grade program reflect
actual lumber in the marketplace rather than statistical theory. The program also addressed
the current status of the material source from large log to small log mills and old growth to
second-growth resource which has changed over time. The 1991 National Design
3
Specification (NDS) first presented allowable dimension lumber stresses based upon the
in-grade procedure. Two major changes to current design criteria are a reduction in allow-
able flexural stress for the more common grades (e.g., #1 and #2) in deeper members (e.g.,
2 × 12s) and nearly doubling of allowable shear stress.
In addition to the allowable stress design industry trade and professional associations
worked to produce a Load Resistance Factor Design (LRFD) Manual of Wood Construction, 3
coordinated by the American Forest and Paper Association/American Wood Council. The
manual was essentially an LRFD conversion of ASD values. The current National Design
3
Specification is very direct about this by including the conversion factors in Appendix N.
With LRFD we are working at the capacity of the material, applying the safety factor on
the loads. Plastic design of steel structures and ultimate strength design of reinforced con-
crete both use the concept of stress redistribution beyond the elastic range of steel, placing
a factor of safety on a failure mechanism rather than a factor of safety on a yield stress with
elastic distribution. This redistribution of stress beyond the elastic limit is a benefit for steel
or reinforced concrete. Exceeding an equivalent of yield stress in timber is not something
we want to do. In fact, we do not want to approach such a stress in timber, at least not for
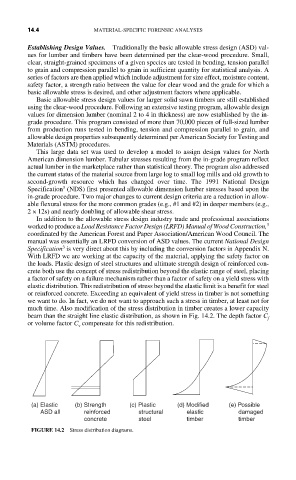
much time. Also modification of the stress distribution in timber creates a lower capacity
beam than the straight line elastic distribution, as shown in Fig. 14.2. The depth factor C f
or volume factor C compensate for this redistribution.
v
(a) Elastic (b) Strength (c) Plastic (d) Modified (e) Possible
ASD all reinforced structural elastic damaged
concrete steel timber timber
FIGURE 14.2 Stress distribution diagrams.