
Page 107 - Formation Damage during Improved Oil Recovery Fundamentals and Applications
P. 107
Formation Damage by Fines Migration: Mathematical and Laboratory Modeling, Field Cases 89
Thus, the higher the Hamaker constant, the larger the particle removed
under a given velocity U. Therefore, the curve r scr (U) shifts to the right as
the Hamaker constant increases.
Fig. 3.9 also shows that the experimental points obtained by Ochi and
Vernoux (1998), are located on the theoretical curve with high precision.
Thus, larger particles are more likely to detach than smaller particles.
The explicit form of the torque balance allows the definition of the criti-
cal particle size:
r scr 5 r s U; γ; pH;Tð Þ: (3.20)
All particles greater than the critical size will detach, and all particles
smaller will remain attached.
The maximum retention function can then be calculated as:
r scr U;γ;pH;TÞ
ð
ð
σ cr U; γ; pH;Tð Þ 5 σ aI fr s ðÞdr s ; (3.21)
0
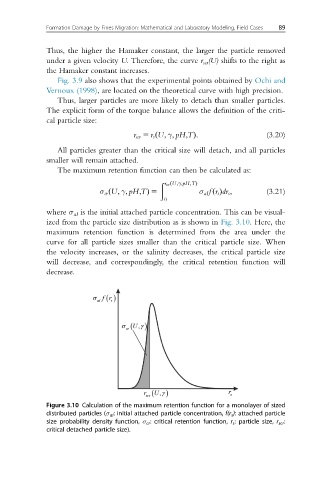
where σ aI is the initial attached particle concentration. This can be visual-
ized from the particle size distribution as is shown in Fig. 3.10. Here, the
maximum retention function is determined from the area under the
curve for all particle sizes smaller than the critical particle size. When
the velocity increases, or the salinity decreases, the critical particle size
will decrease, and correspondingly, the critical retention function will
decrease.
Figure 3.10 Calculation of the maximum retention function for a monolayer of sized
distributed particles (σ aI : initial attached particle concentration, f(r s ): attached particle
size probability density function, σ cr : critical retention function, r s : particle size, r scr :
critical detached particle size).