
Page 117 - Formation Damage during Improved Oil Recovery Fundamentals and Applications
P. 117
Formation Damage by Fines Migration: Mathematical and Laboratory Modeling, Field Cases 99
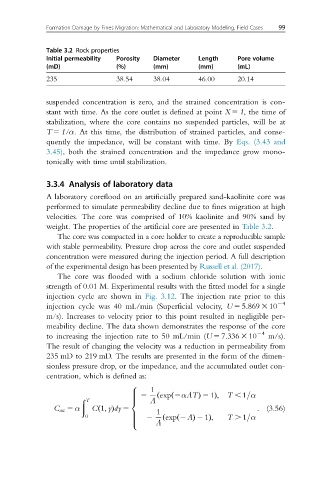
Table 3.2 Rock properties
Initial permeability Porosity Diameter Length Pore volume
(mD) (%) (mm) (mm) (mL)
235 38.54 38.04 46.00 20.14
suspended concentration is zero, and the strained concentration is con-
stant with time. As the core outlet is defined at point X 5 1, the time of
stabilization, where the core contains no suspended particles, will be at
T 5 1/α. At this time, the distribution of strained particles, and conse-
quently the impedance, will be constant with time. By Eqs. (3.43 and
3.45), both the strained concentration and the impedance grow mono-
tonically with time until stabilization.
3.3.4 Analysis of laboratory data
A laboratory coreflood on an artificially prepared sand-kaolinite core was
performed to simulate permeability decline due to fines migration at high
velocities. The core was comprised of 10% kaolinite and 90% sand by
weight. The properties of the artificial core are presented in Table 3.2.
The core was compacted in a core holder to create a reproducible sample
with stable permeability. Pressure drop across the core and outlet suspended
concentration were measured during the injection period. A full description
of the experimental design has been presented by Russell et al. (2017).
The core was flooded with a sodium chloride solution with ionic
strength of 0.01 M. Experimental results with the fitted model for a single
injection cycle are shown in Fig. 3.12. The injection rate prior to this
injection cycle was 40 mL/min (Superficial velocity, U 5 5.869 3 10 24
m/s). Increases to velocity prior to this point resulted in negligible per-
meability decline. The data shown demonstrates the response of the core
24
to increasing the injection rate to 50 mL/min (U 5 7.336 3 10 m/s).
The result of changing the velocity was a reduction in permeability from
235 mD to 219 mD. The results are presented in the form of the dimen-
sionless pressure drop, or the impedance, and the accumulated outlet con-
centration, which is defined as:
1
8
> 2 ð exp 2αΛTÞ 2 1Þ; T , 1=α
ð
>
ð T > Λ
<
C acc 5 α C 1; yÞdy 5 : (3.56)
ð
0 > 2 1 exp 2ΛÞ 2 1Þ; T . 1=α
> ð ð
> Λ
: