Page 159 - Formation Damage during Improved Oil Recovery Fundamentals and Applications
P. 159

Formation Damage by Fines Migration: Mathematical and Laboratory Modeling, Field Cases  137


              where U m (γ) is the maximum velocity for which no particles can be held
              on the grain surface.
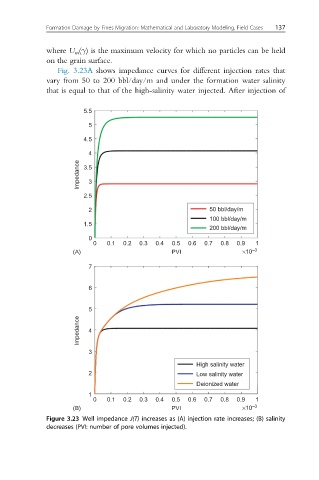
                 Fig. 3.23A shows impedance curves for different injection rates that
              vary from 50 to 200 bbl/day/m and under the formation water salinity
              that is equal to that of the high-salinity water injected. After injection of

                        5.5

                         5
                        4.5

                         4
                      Impedance  3.5 3


                        2.5
                         2                                50 bbl/day/m
                                                          100 bbl/day/m
                        1.5
                                                          200 bbl/day/m
                         0
                          0   0.1  0.2  0.3  0.4  0.5  0.6  0.7  0.8  0.9  1
                     (A)                       PVI                 ×10 –3

                         7

                         6


                         5
                      Impedance  4


                         3
                                                      High salinity water
                         2                            Low salinity water
                                                      Deionized water
                         1
                          0   0.1  0.2  0.3  0.4  0.5  0.6  0.7  0.8  0.9  1
                     (B)                       PVI                 ×10 –3
              Figure 3.23 Well impedance J(T) increases as (A) injection rate increases; (B) salinity
              decreases (PVI: number of pore volumes injected).
   154   155   156   157   158   159   160   161   162   163   164