
Page 143 - T. Anderson-Fracture Mechanics - Fundamentals and Applns.-CRC (2005)
P. 143
1656_C003.fm Page 123 Monday, May 23, 2005 5:42 PM
Elastic-Plastic Fracture Mechanics 123
Equation (3.48) indicates that d = 1/m, assuming s = s (see Footnote 2). According to Figure
YS
o
n
3.18(a), d = 1.0 for a nonhardening material (n = ∞) in plane stress, which agrees with the strip-
n
yield model (Equation (3.44)).
The Shih analysis shows that there is a unique relationship between J and CTOD for a given
material. Thus these two quantities are equally valid crack-tip-characterizing parameters for elastic-
plastic materials. The fracture toughness of a material can be quantified either by a critical value
of J or CTOD.
The above analysis contains an apparent inconsistency. Equation (3.48) is based on the HRR
singularity, which does not account for large geometry changes at the crack tip. Figure 3.12 indicates
that the stresses predicted by the HRR theory are inaccurate for r < 2d, but the Shih analysis uses
the HRR solution to evaluate displacements well within the large strain region. Crack-tip finite
element analyses [14], however, are in general agreement with Equation (3.48). Thus the displace-
ment fields predicted from the HRR theory are reasonably accurate, despite the large plastic strains
at the crack tip.
3.4 CRACK-GROWTH RESISTANCE CURVES
Many materials with high toughness do not fail catastrophically at a particular value of J or CTOD.
Rather, these materials display a rising R curve, where J and CTOD increase with crack growth.
In metals, a rising R curve is normally associated with the growth and coalescence of microvoids.
See Chapter 5 for a discussion of microscopic fracture mechanisms in ductile metals.
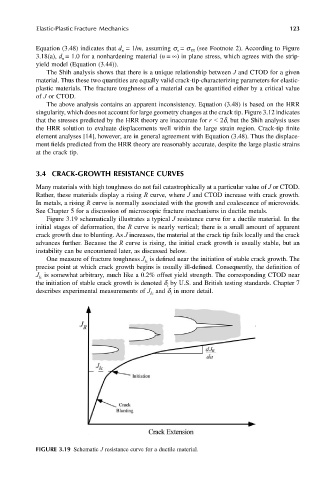
Figure 3.19 schematically illustrates a typical J resistance curve for a ductile material. In the
initial stages of deformation, the R curve is nearly vertical; there is a small amount of apparent
crack growth due to blunting. As J increases, the material at the crack tip fails locally and the crack
advances further. Because the R curve is rising, the initial crack growth is usually stable, but an
instability can be encountered later, as discussed below.
One measure of fracture toughness J is defined near the initiation of stable crack growth. The
Ic
precise point at which crack growth begins is usually ill-defined. Consequently, the definition of
J is somewhat arbitrary, much like a 0.2% offset yield strength. The corresponding CTOD near
Ic
the initiation of stable crack growth is denoted d by U.S. and British testing standards. Chapter 7
i
describes experimental measurements of J and d in more detail.
i
Ic
FIGURE 3.19 Schematic J resistance curve for a ductile material.