
Page 144 - T. Anderson-Fracture Mechanics - Fundamentals and Applns.-CRC (2005)
P. 144
1656_C003.fm Page 124 Monday, May 23, 2005 5:42 PM
124 Fracture Mechanics: Fundamentals and Applications
While initiation toughness provides some information about the fracture behavior of a ductile
material, the entire R curve gives a more complete description. The slope of the R curve at a given
amount of crack extension is indicative of the relative stability of the crack growth; a material with
a steep R curve is less likely to experience unstable crack propagation. For J resistance curves, the
slope is usually quantified by a dimensionless tearing modulus:
E dJ
T = σ o 2 da R (3.49)
R
where the subscript R indicates a value of J on the resistance curve.
3.4.1 STABLE AND UNSTABLE CRACK GROWTH
The conditions that govern the stability of crack growth in elastic-plastic materials are virtually
identical to the elastic case presented in Section 2.5. Instability occurs when the driving force curve
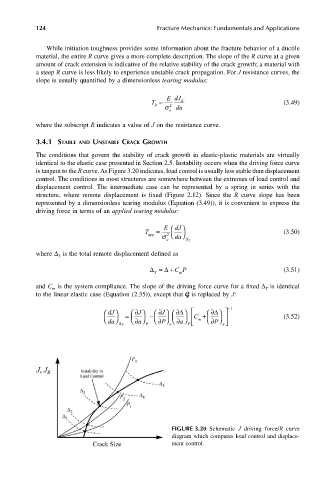
is tangent to the R curve. As Figure 3.20 indicates, load control is usually less stable than displacement
control. The conditions in most structures are somewhere between the extremes of load control and
displacement control. The intermediate case can be represented by a spring in series with the
structure, where remote displacement is fixed (Figure 2.12). Since the R curve slope has been
represented by a dimensionless tearing modulus (Equation (3.49)), it is convenient to express the
driving force in terms of an applied tearing modulus:
E d J
T app = σ o 2 da ∆ T (3.50)
where ∆ is the total remote displacement defined as
T
∆ T ∆ = + CP (3.51)
m
and C is the system compliance. The slope of the driving force curve for a fixed ∆ is identical
m
T
to the linear elastic case (Equation (2.35)), except that G is replaced by J:
dJ = J ∂ J ∂ ∆ ∂ C + ∆ ∂ −1
a
da ∆ T a ∂ − ∂ P ∂ m ∂ P (3.52)
a
P
a
P
FIGURE 3.20 Schematic J driving force/R curve
diagram which compares load control and displace-
ment control.