
Page 243 - T. Anderson-Fracture Mechanics - Fundamentals and Applns.-CRC (2005)
P. 243
1656_C005.fm Page 223 Monday, May 23, 2005 5:47 PM
Fracture Mechanisms in Metals 223
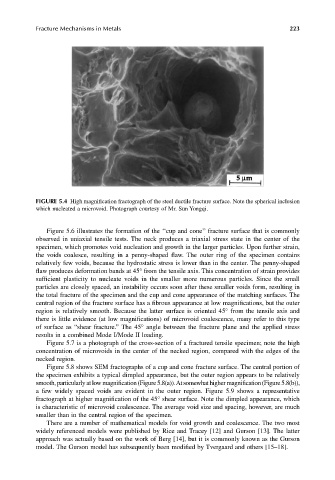
FIGURE 5.4 High magnification fractograph of the steel ductile fracture surface. Note the spherical inclusion
which nucleated a microvoid. Photograph courtesy of Mr. Sun Yongqi.
Figure 5.6 illustrates the formation of the ‘‘cup and cone’’ fracture surface that is commonly
observed in uniaxial tensile tests. The neck produces a triaxial stress state in the center of the
specimen, which promotes void nucleation and growth in the larger particles. Upon further strain,
the voids coalesce, resulting in a penny-shaped flaw. The outer ring of the specimen contains
relatively few voids, because the hydrostatic stress is lower than in the center. The penny-shaped
flaw produces deformation bands at 45° from the tensile axis. This concentration of strain provides
sufficient plasticity to nucleate voids in the smaller more numerous particles. Since the small
particles are closely spaced, an instability occurs soon after these smaller voids form, resulting in
the total fracture of the specimen and the cup and cone appearance of the matching surfaces. The
central region of the fracture surface has a fibrous appearance at low magnifications, but the outer
region is relatively smooth. Because the latter surface is oriented 45° from the tensile axis and
there is little evidence (at low magnifications) of microvoid coalescence, many refer to this type
of surface as “shear fracture.” The 45° angle between the fracture plane and the applied stress
results in a combined Mode I/Mode II loading.
Figure 5.7 is a photograph of the cross-section of a fractured tensile specimen; note the high
concentration of microvoids in the center of the necked region, compared with the edges of the
necked region.
Figure 5.8 shows SEM fractographs of a cup and cone fracture surface. The central portion of
the specimen exhibits a typical dimpled appearance, but the outer region appears to be relatively
smooth, particularly at low magnification (Figure 5.8(a)). At somewhat higher magnification (Figure 5.8(b)),
a few widely spaced voids are evident in the outer region. Figure 5.9 shows a representative
fractograph at higher magnification of the 45° shear surface. Note the dimpled appearance, which
is characteristic of microvoid coalescence. The average void size and spacing, however, are much
smaller than in the central region of the specimen.
There are a number of mathematical models for void growth and coalescence. The two most
widely referenced models were published by Rice and Tracey [12] and Gurson [13]. The latter
approach was actually based on the work of Berg [14], but it is commonly known as the Gurson
model. The Gurson model has subsequently been modified by Tvergaard and others [15–18].