
Page 183 - Fundamentals of Air Pollution 3E
P. 183
V. Acidic Deposition 149
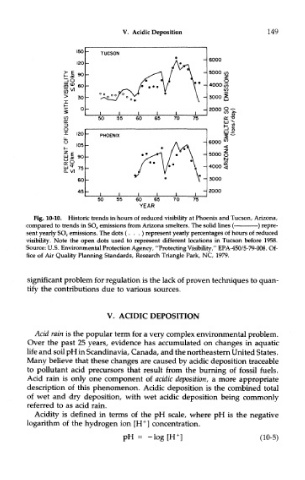
Fig. 10-10. Historic trends in hours of reduced visibility at Phoenix and Tucson, Arizona,
compared to trends in SO* emissions from Arizona smelters. The solid lines ( ) repre-
sent yearly SO^ emissions. The dots (... ) represent yearly percentages of hours of reduced
visibility. Note the open dots used to represent different locations in Tucson before 1958.
Source: U.S. Environmental Protection Agency, "Protecting Visibility," EPA-45Q/5-79-008. Of-
fice of Air Quality Planning Standards, Research Triangle Park, NC, 1979.
significant problem for regulation is the lack of proven techniques to quan-
tify the contributions due to various sources.
V. ACIDIC DEPOSITION
Acid rain is the popular term for a very complex environmental problem.
Over the past 25 years, evidence has accumulated on changes in aquatic
life and soil pH in Scandinavia, Canada, and the northeastern United States.
Many believe that these changes are caused by acidic deposition traceable
to pollutant acid precursors that result from the burning of fossil fuels.
Acid rain is only one component of acidic deposition, a more appropriate
description of this phenomenon. Acidic deposition is the combined total
of wet and dry deposition, with wet acidic deposition being commonly
referred to as acid rain.
Acidity is defined in terms of the pH scale, where pH is the negative
+
logarithm of the hydrogen ion [H ] concentration.