
Page 185 - Fundamentals of Air Pollution 3E
P. 185
V. Acidic Deposition 151
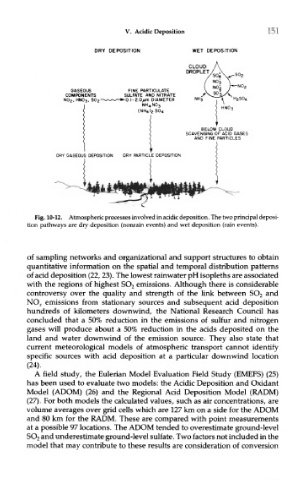
Fig. 10-12. Atmospheric processes involved in acidic deposition. The two principal deposi-
tion pathways are dry deposition (nonrain events) and wet deposition (rain events).
of sampling networks and organizational and support structures to obtain
quantitative information on the spatial and temporal distribution patterns
of acid deposition (22, 23). The lowest rainwater pH isopleths are associated
with the regions of highest SO 2 emissions. Although there is considerable
controversy over the quality and strength of the link between SO 2 and
NO X emissions from stationary sources and subsequent acid deposition
hundreds of kilometers downwind, the National Research Council has
concluded that a 50% reduction in the emissions of sulfur and nitrogen
gases will produce about a 50% reduction in the acids deposited on the
land and water downwind of the emission source. They also state that
current meteorological models of atmospheric transport cannot identify
specific sources with acid deposition at a particular downwind location
(24).
A field study, the Eulerian Model Evaluation Field Study (EMEFS) (25)
has been used to evaluate two models: the Acidic Deposition and Oxidant
Model (ADOM) (26) and the Regional Acid Deposition Model (RADM)
(27). For both models the calculated values, such as air concentrations, are
volume averages over grid cells which are 127 km on a side for the ADOM
and 80 km for the RADM. These are compared with point measurements
at a possible 97 locations. The ADOM tended to overestimate ground-level
SO 2 and underestimate ground-level sulfate. Two factors not included in the
model that may contribute to these results are consideration of conversion