
Page 231 - Fundamentals of Enhanced Oil and Gas Recovery
P. 231
Waterflooding 219
This correlation was applied in our analysis and assuming @P c =@r is negligible,
various capillary pressure was estimated for increasing water saturation. Note that the
free water level (FWL) was assumed at a height of 20 ft; hence we could predict our
threshold pressure to be
P d 5 Δρgh (7.55)
3 3
Assuming water density of 1005 kg/m and oil density of 900 kg/m with g taken
2
as 9.81 m/s . P d was calculated to be 0.91 psi. Brooks and Corey related the rock
parameter λ to the distribution of pore sizes. For narrow distribution λ is .2 and for
wide distribution λ is ,2. For this analysis, a normal distribution was assumed and
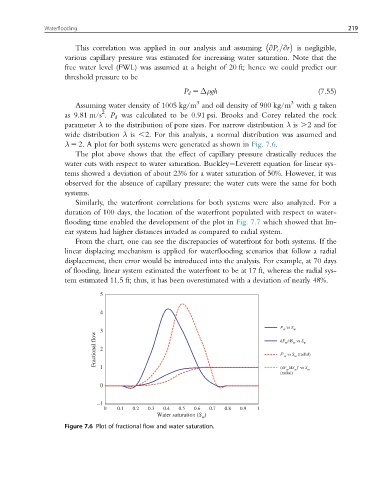
λ 5 2. A plot for both systems were generated as shown in Fig. 7.6.
The plot above shows that the effect of capillary pressure drastically reduces the
water cuts with respect to water saturation. Buckley Leverett equation for linear sys-
tems showed a deviation of about 23% for a water saturation of 50%. However, it was
observed for the absence of capillary pressure; the water cuts were the same for both
systems.
Similarly, the waterfront correlations for both systems were also analyzed. For a
duration of 100 days, the location of the waterfront populated with respect to water-
flooding time enabled the development of the plot in Fig. 7.7 which showed that lin-
ear system had higher distances invaded as compared to radial system.
From the chart, one can see the discrepancies of waterfront for both systems. If the
linear displacing mechanism is applied for waterflooding scenarios that follow a radial
displacement, then error would be introduced into the analysis. For example, at 70 days
of flooding, linear system estimated the waterfront to be at 17 ft, whereas the radial sys-
tem estimated 11.5 ft; thus, it has been overestimated with a deviation of nearly 48%.
5
4
vs S
F w w
Fractional flow 3 2 dF /dS vs S w
w
w
F' vs S (radial)
w
w
1
(dF /dS )' vs S
w w w
(radial)
0
–1
0 0.1 0.2 0.3 0.4 0.5 0.6 0.7 0.8 0.9 1
Water saturation (S w )
Figure 7.6 Plot of fractional flow and water saturation.