
Page 25 - Fundamentals of Enhanced Oil and Gas Recovery
P. 25
An Introduction to Enhanced Oil Recovery 13
a single-phase liquid, and below the bubble point oil and gas are in equilibrium.
Although this parameter is mainly measured by experimental methods, many empiri-
cal correlations are developed to be used in the absence of experimental instruments.
1.9.11 Oil Formation Volume Factor
The oil formation factor is equal to the volume of the oil under reservoir condition
divided by the volume of the oil at standard condition.
B o 5 V o reservoir
V o
S:C
where
B o is oil formation volume factor
is volume of oil in reservoir condition
V o reservoir
V o is volume of oil in standard condition
S:C
Above the bubble point pressure the oil formation volume factor increases by pres-
sure drop. This is due to oil expansion in reservoir by pressure drop. On the contrary,
below the bubble point pressure oil formation volume factor decreases by pressure
decline. The reason is that below the bubble point pressure when the pressure drops,
gas is liberated from oil, and consequently, the volume of oil in reservoir decreases.
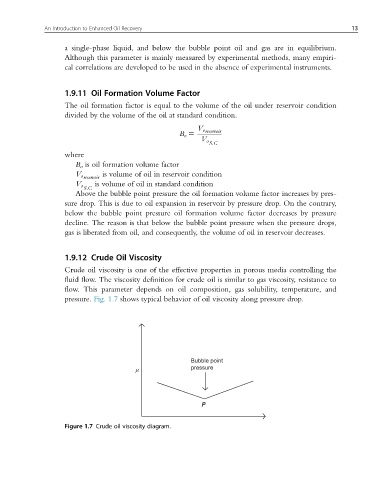
1.9.12 Crude Oil Viscosity
Crude oil viscosity is one of the effective properties in porous media controlling the
fluid flow. The viscosity definition for crude oil is similar to gas viscosity, resistance to
flow. This parameter depends on oil composition, gas solubility, temperature, and
pressure. Fig. 1.7 shows typical behavior of oil viscosity along pressure drop.
Bubble point
μ pressure
P
Figure 1.7 Crude oil viscosity diagram.