
Page 20 - Fundamentals of Enhanced Oil and Gas Recovery
P. 20
8 Amirhossein Mohammadi Alamooti and Farzan Karimi Malekabadi
Solid Liquid
Melting-point line
p Gas
Vapor-pressure line
T
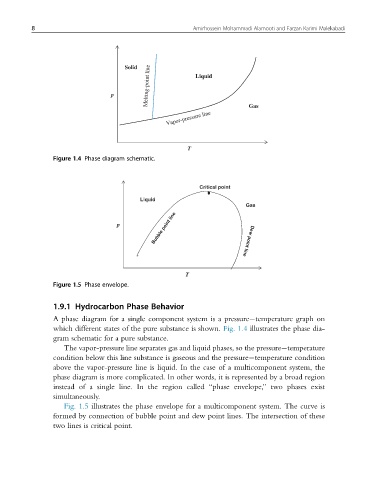
Figure 1.4 Phase diagram schematic.
Critical point
Liquid
Gas
Bubble point line Dew point line
p
T
Figure 1.5 Phase envelope.
1.9.1 Hydrocarbon Phase Behavior
A phase diagram for a single component system is a pressure temperature graph on
which different states of the pure substance is shown. Fig. 1.4 illustrates the phase dia-
gram schematic for a pure substance.
The vapor-pressure line separates gas and liquid phases, so the pressure temperature
condition below this line substance is gaseous and the pressure temperature condition
above the vapor-pressure line is liquid. In the case of a multicomponent system, the
phase diagram is more complicated. In other words, it is represented by a broad region
instead of a single line. In the region called “phase envelope,” two phases exist
simultaneously.
Fig. 1.5 illustrates the phase envelope for a multicomponent system. The curve is
formed by connection of bubble point and dew point lines. The intersection of these
two lines is critical point.