
Page 192 - Fundamentals of Gas Shale Reservoirs
P. 192
172 GEOMECHANICS OF GAS SHALES
80
70
60
50
1 – 3 (MPa) 40
30
1 2
20
3
10
v
0
–4 –2 0 2 4
(%)
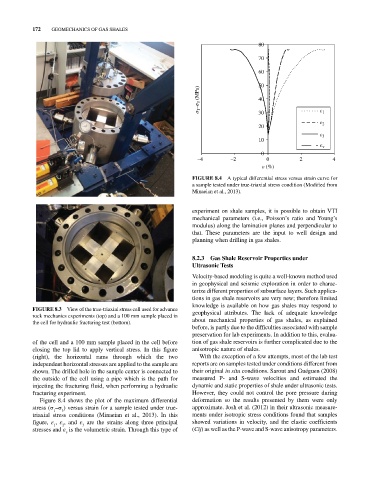
FIGURE 8.4 A typical differential stress versus strain curve for
a sample tested under true‐triaxial stress condition (Modified from
Minaeian et al., 2013).
experiment on shale samples, it is possible to obtain VTI
mechanical parameters (i.e., Poisson’s ratio and Young’s
modulus) along the lamination planes and perpendicular to
that. These parameters are the input to well design and
planning when drilling in gas shales.
8.2.3 Gas Shale Reservoir Properties under
Ultrasonic Tests
Velocity‐based modeling is quite a well‐known method used
in geophysical and seismic exploration in order to charac
terize different properties of subsurface layers. Such applica
tions in gas shale reservoirs are very new; therefore limited
knowledge is available on how gas shales may respond to
FIGURE 8.3 View of the true‐triaxial stress cell used for advance geophysical attributes. The lack of adequate knowledge
rock mechanics experiments (top) and a 100 mm sample placed in
the cell for hydraulic fracturing test (bottom). about mechanical properties of gas shales, as explained
before, is partly due to the difficulties associated with sample
preservation for lab experiments. In addition to this, evalua
of the cell and a 100 mm sample placed in the cell before tion of gas shale reservoirs is further complicated due to the
closing the top lid to apply vertical stress. In this figure anisotropic nature of shales.
(right), the horizontal rams through which the two With the exception of a few attempts, most of the lab test
independent horizontal stresses are applied to the sample are reports are on samples tested under conditions different from
shown. The drilled hole in the sample center is connected to their original in situ conditions. Sarout and Guéguen (2008)
the outside of the cell using a pipe which is the path for measured P‐ and S‐wave velocities and estimated the
injecting the fracturing fluid, when performing a hydraulic dynamic and static properties of shale under ultrasonic tests.
fracturing experiment. However, they could not control the pore pressure during
Figure 8.4 shows the plot of the maximum differential deformation so the results presented by them were only
stress (σ –σ ) versus strain for a sample tested under true‐ approximate. Josh et al. (2012) in their ultrasonic measure
1
3
triaxial stress conditions (Minaeian et al., 2013). In this ments under isotropic stress conditions found that samples
figure, ε , ε , and ε are the strains along three principal showed variations in velocity, and the elastic coefficients
3
1
2
stresses and ε is the volumetric strain. Through this type of (Cij) as well as the P‐wave and S‐wave anisotropy parameters.
v