Page 24 - Fundamentals of Gas Shale Reservoirs
P. 24

4   GAS SHALE: GLOBAL SIGNIFICANCE, DISTRIBUTION, AND CHALLENGES

            (EIA, 2011a) indicate the average EUR/well is 1.02 Bcf/  1.3  THE SIGNIFICANCE OF SHALE GAS
            well. To compare this to a conventional development, the
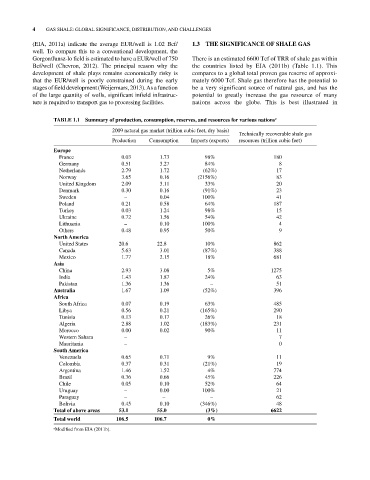
            Gorgon/Jansz­lo field is estimated to have a EUR/well of 750   There is an estimated 6600 Tcf of TRR of shale gas within
            Bcf/well  (Chevron,  2012).  The  principal  reason  why  the   the countries listed by EIA (2011b) (Table  1.1).  This
            develop ment of shale plays remains economically risky is   compares to a global total proven gas reserve of approxi­
            that the EUR/well is poorly constrained during the early   mately 6000 Tcf. Shale gas therefore has the potential to
            stages of field development (Weijermars, 2013). As a function   be a very significant source of natural gas, and has the
            of the large quantity of wells, significant infield infrastruc­  potential to greatly increase the gas resource of many
            ture is required to transport gas to processing facilities.  nations across the globe.  This is best illustrated in


                   TABLE 1.1  Summary of production, consumption, reserves, and resources for various nations a
                                      2009 natural gas market (trillion cubic feet, dry basis)
                                                                                Technically recoverable shale gas
                                      Production  Consumption   Imports (exports)  resources (trillion cubic feet)
                   Europe
                     France              0.03         1.73           98%                    180
                     Germany             0.51         3.27           84%                     8
                     Netherlands         2.79         1.72          (62%)                   17
                     Norway              3.65         0.16        (2156%)                   83
                     United Kingdom      2.09         3.11           33%                    20
                     Denmark             0.30         0.16          (91%)                   23
                     Sweden               –           0.04          100%                    41
                     Poland              0.21         0.58           64%                    187
                     Turkey              0.03         1.24           98%                    15
                     Ukraine             0.72         1.56           54%                    42
                     Lithuania            –           0.10          100%                     4
                     Others              0.48         0.95           50%                     9
                   North America
                     United States      20.6         22.8            10%                    862
                     Canada              5.63         3.01          (87%)                   388
                     Mexico              1.77         2.15           18%                    681
                   Asia
                     China               2.93         3.08            5%                   1275
                     India               1.43         1.87           24%                    63
                     Pakistan            1.36         1.36             –                    51
                   Australia             1.67         1.09          (52%)                   396
                   Africa
                     South Africa        0.07         0.19           63%                    485
                     Libya               0.56         0.21         (165%)                   290
                     Tunisia             0.13         0.17           26%                    18
                     Algeria             2.88         1.02         (183%)                   231
                     Morocco             0.00         0.02           90%                    11
                     Western Sahara       –                                                  7
                     Mauritania           –                                                  0
                   South America
                     Venezuela           0.65         0.71            9%                    11
                     Colombia            0.37         0.31          (21%)                   19
                     Argentina           1.46         1.52            4%                    774
                     Brazil              0.36         0.66           45%                    226
                     Chile               0.05         0.10           52%                    64
                     Uruguay              –           0.00          100%                    21
                     Paraguay             –            –               –                    62
                     Bolivia             0.45         0.10         (346%)                   48
                   Total of above areas  53.1        55.0            (3%)                  6622
                   Total world         106.5        106.7             0%
                   a Modified from EIA (2011b).
   19   20   21   22   23   24   25   26   27   28   29