
Page 25 - Fundamentals of Gas Shale Reservoirs
P. 25
GLOBAL SHALE GAS RESOURCES 5
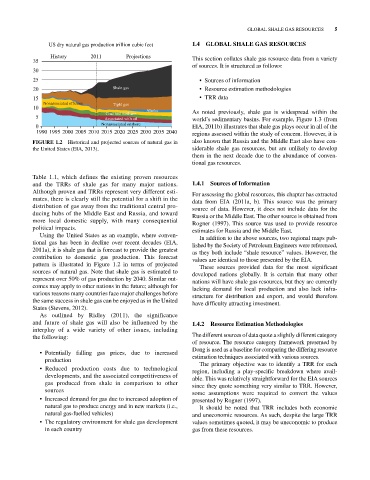
US dry natural gas production trillion cubic feet 1.4 GLOBAL SHALE GAS RESOURCES
History 2011 Projections This section collates shale gas resource data from a variety
35
of sources. It is structured as follows:
30
25 • Sources of information
20 Shale gas • Resource estimation methodologies
15 • TRR data
Nonassociated offshore Tight gas
10 Alaska
Coal bed methane As noted previously, shale gas is widespread within the
5 Associated with oil world’s sedimentary basins. For example, Figure 1.3 (from
0 Nonassociated onshore EIA, 2011b) illustrates that shale gas plays occur in all of the
1990 1995 2000 2005 2010 2015 2020 2025 2030 2035 2040 regions assessed within the study of concern. However, it is
FIGURE 1.2 Historical and projected sources of natural gas in also known that Russia and the Middle East also have con
the United States (EIA, 2013). siderable shale gas resources, but are unlikely to develop
them in the next decade due to the abundance of conven
tional gas resources.
Table 1.1, which defines the existing proven resources
and the TRRs of shale gas for many major nations. 1.4.1 Sources of Information
Although proven and TRRs represent very different esti For assessing the global resources, this chapter has extracted
mates, there is clearly still the potential for a shift in the data from EIA (2011a, b). This source was the primary
distribution of gas away from the traditional central pro source of data. However, it does not include data for the
ducing hubs of the Middle East and Russia, and toward Russia or the Middle East. The other source is obtained from
more local domestic supply, with many consequential Rogner (1997). This source was used to provide resource
political impacts. estimates for Russia and the Middle East.
Using the United States as an example, where conven In addition to the above sources, two regional maps pub
tional gas has been in decline over recent decades (EIA, lished by the Society of Petroleum Engineers were referenced,
2011a), it is shale gas that is forecast to provide the greatest as they both include “shale resource” values. However, the
contribution to domestic gas production. This forecast values are identical to those presented by the EIA.
pattern is illustrated in Figure 1.2 in terms of projected These sources provided data for the most significant
sources of natural gas. Note that shale gas is estimated to developed nations globally. It is certain that many other
represent over 50% of gas production by 2040. Similar out nations will have shale gas resources, but they are currently
comes may apply to other nations in the future; although for lacking demand for local production and also lack infra
various reasons many countries face major challenges before structure for distribution and export, and would therefore
the same success in shale gas can be enjoyed as in the United have difficulty attracting investment.
States (Stevens, 2012).
As outlined by Ridley (2011), the significance
and future of shale gas will also be influenced by the 1.4.2 Resource Estimation Methodologies
interplay of a wide variety of other issues, including
the following: The different sources of data quote a slightly different category
of resource. The resource category framework presented by
Dong is used as a baseline for comparing the differing resource
• Potentially falling gas prices, due to increased
production estimation techniques associated with various sources.
The primary objective was to identify a TRR for each
• Reduced production costs due to technological region, including a play‐specific breakdown where avail
developments, and the associated competitiveness of able. This was relatively straightforward for the EIA sources
gas produced from shale in comparison to other since they quote something very similar to TRR. However,
sources some assumptions were required to convert the values
• Increased demand for gas due to increased adoption of presented by Rogner (1997).
natural gas to produce energy and in new markets (i.e., It should be noted that TRR includes both economic
natural gas‐fuelled vehicles) and uneconomic resources. As such, despite the large TRR
• The regulatory environment for shale gas development values sometimes quoted, it may be uneconomic to produce
in each country gas from these resources.