
Page 124 - Fundamentals of Ocean Renewable Energy Generating Electricity From The Sea
P. 124
Wave Energy Chapter | 5 115
Individual sine waves Amplitude versus frequency
7 6
Water surface elevation (m) 5 0 T= 3.3 s T= 10 s Amplitude (m) 5 4 3 2
10
T = 2.5 s
T= 5 s
−5
0 2 4 6 8 10 1 0 0 0.1 0.2 0.3 0.4
Time (s) Frequency (Hz)
Combined irregular wave Energy density versus frequency
Water surface elevation (m) −5 5 0 Energy spectrum (m 2 /Hz) 400
10
300
200
100
−10
0
0 2 4 6 8 10 0 0.1 0.2 0.3 0.4
Time (s) Frequency (Hz)
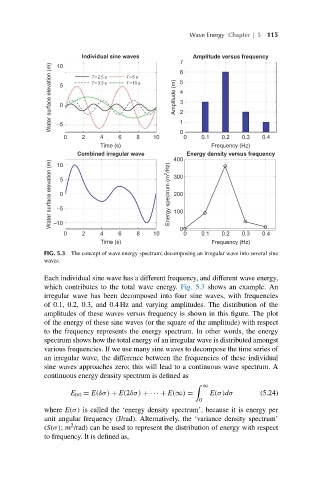
FIG. 5.3 The concept of wave energy spectrum; decomposing an irregular wave into several sine
waves.
Each individual sine wave has a different frequency, and different wave energy,
which contributes to the total wave energy. Fig. 5.3 shows an example. An
irregular wave has been decomposed into four sine waves, with frequencies
of 0.1, 0.2, 0.3, and 0.4 Hz and varying amplitudes. The distribution of the
amplitudes of these waves versus frequency is shown in this figure. The plot
of the energy of these sine waves (or the square of the amplitude) with respect
to the frequency represents the energy spectrum. In other words, the energy
spectrum shows how the total energy of an irregular wave is distributed amongst
various frequencies. If we use many sine waves to decompose the time series of
an irregular wave, the difference between the frequencies of these individual
sine waves approaches zero; this will lead to a continuous wave spectrum. A
continuous energy density spectrum is defined as
∞
E tot = E(δσ) + E(2δσ) + ··· + E(∞) = E(σ)dσ (5.24)
0
where E(σ) is called the ‘energy density spectrum’, because it is energy per
unit angular frequency (J/rad). Alternatively, the ‘variance density spectrum’
2
(S(σ);m /rad) can be used to represent the distribution of energy with respect
to frequency. It is defined as,