
Page 276 - Fundamentals of Ocean Renewable Energy Generating Electricity From The Sea
P. 276
Optimization Chapter | 9 263
wind arrays. Aggregate power from a colocated wind and wave farm achieves
reductions in variability equivalent to aggregating power from two offshore
wind farms approximately 500 km apart, or two wave farms approximately
800 km apart [35].
In general, a trend of energetic wind and wave activity in winter months
coincides with an increased demand for electricity for heating and lighting
(e.g. see Fig. 10.1 in the next chapter). However, with significant interannual
variability in the wind and wave resources, it is a high-risk strategy to put too
much reliance on these stochastic forms of energy conversion. In Fig. 1.12C,
we looked at how demand for electricity varied throughout the day, with well-
defined peaks at around 08:00 and 18:00. It would therefore be useful if a
wind/wave energy mix could be optimized to match these peaks in demand.
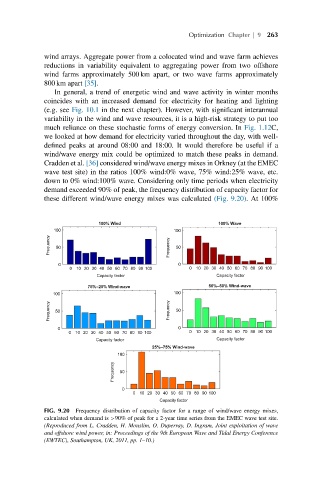
Cradden et al. [36] considered wind/wave energy mixes in Orkney (at the EMEC
wave test site) in the ratios 100% wind:0% wave, 75% wind:25% wave, etc.
down to 0% wind:100% wave. Considering only time periods when electricity
demand exceeded 90% of peak, the frequency distribution of capacity factor for
these different wind/wave energy mixes was calculated (Fig. 9.20). At 100%
100% Wind 100% Wave
100 100
Frequency 50 Frequency 50
0 0
0 102030405060708090 100 0 102030405060708090 100
Capacity factor Capacity factor
75%–25% Wind-wave 50%–50% Wind-wave
100 100
Frequency 50 Frequency 50
0 0
0 102030405060708090 100 0 102030405060708090 100
Capacity factor Capacity factor
25%–75% Wind-wave
100
Frequency 50
0
0 102030405060708090 100
Capacity factor
FIG. 9.20 Frequency distribution of capacity factor for a range of wind/wave energy mixes,
calculated when demand is >90% of peak for a 2-year time series from the EMEC wave test site.
(Reproduced from L. Cradden, H. Mouslim, O. Duperray, D. Ingram, Joint exploitation of wave
and offshore wind power, in: Proceedings of the 9th European Wave and Tidal Energy Conference
(EWTEC), Southampton, UK, 2011, pp. 1–10.)