
Page 97 - Fundamentals of Ocean Renewable Energy Generating Electricity From The Sea
P. 97
90 Fundamentals of Ocean Renewable Energy
block and also extract energy from the flow, they cause a reduction in the wind
velocity at the turbine (or disk), and also in the wake of the turbine. Considering
the continuity equation in the steady state (i.e. Q = Au), this flow reduction
means that the flow area will increase at the turbine, and even more at the wake
as shown in the figure. The average wind velocity at the turbine can be written in
terms of the axial flow induction factor (a). An induction factor of 1 means that
the wind turbine does not affect the upwind velocity at all (u dis = u o ), whereas
a = 0 means that the turbine completely blocks/stops the wind (u dis = 0).
Practically, the induction factor is between 0 and 1. It can be shown that the
power coefficient is a function of the flow induction factor as follows (see
Chapter 3):
P e 2
C p = = 4a(1 − a) (4.4)
P t
The maximum power coefficient can be evaluated by taking the derivative
dC p 2 1 16
= 4(1 − a) − 8a(1 − a) = 0 ⇒ a = and C p = (4.5)
dp 3 27
Therefore, the maximum power coefficient is 16 = 0.593, corresponding to
27
a = 1/3. The above limit is called the Betz limit after Albert Betz, a German
scientist, who pioneered wind turbine technology.
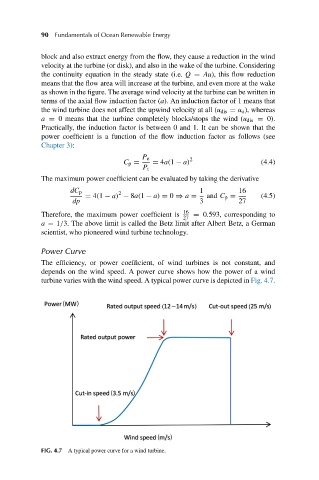
Power Curve
The efficiency, or power coefficient, of wind turbines is not constant, and
depends on the wind speed. A power curve shows how the power of a wind
turbine varies with the wind speed. A typical power curve is depicted in Fig. 4.7.
FIG. 4.7 A typical power curve for a wind turbine.