
Page 102 - Fundamentals of Ocean Renewable Energy Generating Electricity From The Sea
P. 102
Offshore Wind Chapter | 4 95
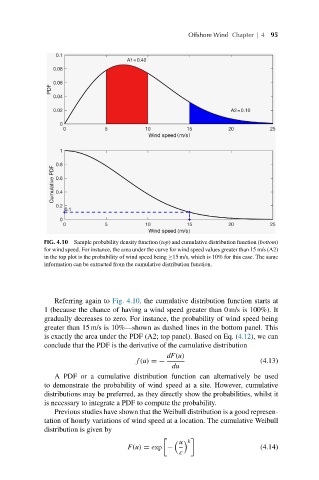
FIG. 4.10 Sample probability density function (top) and cumulative distribution function (bottom)
for wind speed. For instance, the area under the curve for wind speed values greater than 15 m/s (A2)
in the top plot is the probability of wind speed being ≥15 m/s, which is 10% for this case. The same
information can be extracted from the cumulative distribution function.
Referring again to Fig. 4.10, the cumulative distribution function starts at
1 (because the chance of having a wind speed greater than 0 m/s is 100%). It
gradually decreases to zero. For instance, the probability of wind speed being
greater than 15 m/s is 10%—shown as dashed lines in the bottom panel. This
is exactly the area under the PDF (A2; top panel). Based on Eq. (4.12), we can
conclude that the PDF is the derivative of the cumulative distribution
dF(u)
f(u) =− (4.13)
du
A PDF or a cumulative distribution function can alternatively be used
to demonstrate the probability of wind speed at a site. However, cumulative
distributions may be preferred, as they directly show the probabilities, whilst it
is necessary to integrate a PDF to compute the probability.
Previous studies have shown that the Weibull distribution is a good represen-
tation of hourly variations of wind speed at a location. The cumulative Weibull
distribution is given by
u k
F(u) = exp − (4.14)
c