
Page 107 - Fundamentals of Ocean Renewable Energy Generating Electricity From The Sea
P. 107
100 Fundamentals of Ocean Renewable Energy
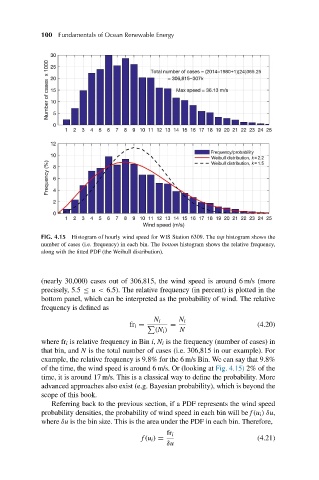
FIG. 4.15 Histogram of hourly wind speed for WIS Station 6309. The top histogram shows the
number of cases (i.e. frequency) in each bin. The bottom histogram shows the relative frequency,
along with the fitted PDF (the Weibull distribution).
(nearly 30,000) cases out of 306,815, the wind speed is around 6 m/s (more
precisely, 5.5 ≤ u < 6.5). The relative frequency (in percent) is plotted in the
bottom panel, which can be interpreted as the probability of wind. The relative
frequency is defined as
N i N i
= (4.20)
(N i ) N
fr i =
where fr i is relative frequency in Bin i, N i is the frequency (number of cases) in
that bin, and N is the total number of cases (i.e. 306,815 in our example). For
example, the relative frequency is 9.8% for the 6 m/s Bin. We can say that 9.8%
of the time, the wind speed is around 6 m/s. Or (looking at Fig. 4.15) 2% of the
time, it is around 17 m/s. This is a classical way to define the probability. More
advanced approaches also exist (e.g. Bayesian probability), which is beyond the
scope of this book.
Referring back to the previous section, if a PDF represents the wind speed
probability densities, the probability of wind speed in each bin will be f(u i )δu,
where δu is the bin size. This is the area under the PDF in each bin. Therefore,
fr i
f(u i ) = (4.21)
δu