
Page 247 - Fundamentals of Probability and Statistics for Engineers
P. 247
230 Fundamentals of Probability and Statistics for Engineers
The mean and variance associated with the Type-I maximum-value distribu-
tion can be obtained through integration using Equation (7.90). We have noted
that u is the mode of the distribution, that is, the value of y at which f (y) is
Y
maximum. The mean of Y is
m Y u ;
7:102
where
' :
0 577 is Euler’s constant; and the variance is given by
2
2
:
7:103
Y 6 2
It is seen from the above that u and are, respectively, the location and scale
parameters of the distribution. It is interesting to note that the skewness
coefficient, defined by Equation (4.11), in this case is
1 ' 1:1396;
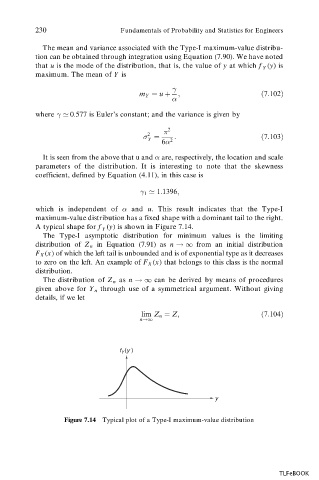
which is independent of and u. This result indicates that the Type-I
maximum-value distribution has a fixed shape with a dominant tail to the right.
A typical shape for f (y) is shown in Figure 7.14.
Y
The Type-I asymptotic distribution for minimum values is the limiting
distribution of Z n in Equation (7.91) as n !1 from an initial distribution
F X (x) of which the left tail is unbounded and is of exponential type as it decreases
to zero on the left. An example of F X (x) that belongs to this class is the normal
distribution.
The distribution of Z n as n !1 can be derived by means of procedures
given above for Y n through use of a symmetrical argument. Without giving
details, if we let
lim Z n Z;
7:104
n!1
f (y )
Y
y
Figure 7.14 Typical plot of a Type-I maximum-value distribution
TLFeBOOK