
Page 358 - Fundamentals of Probability and Statistics for Engineers
P. 358
Linear Models and Linear Regression 341
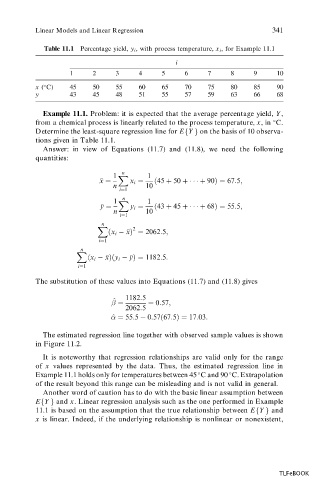
Table 11.1 Percentage yield, y i , with process temperature, x i , for Example 11.1
i
1 2 3 4 5 6 7 8 9 10
x ( C) 45 50 55 60 65 70 75 80 85 90
y 43 45 48 51 55 57 59 63 66 68
Example 11.1. Problem: it is expected that the average percentage yield, Y ,
from a chemical process is linearly related to the process temperature, x, in C.
Determine the least-square regression line for E Y on the basis of 10 observa-
f g
tions given in Table 11.1.
Answer: in view of Equations (11.7) and (11.8), we need the following
quantities:
n
1 X 1
x x i
45 50 90 67:5;
n 10
i1
n
1 X 1
y y i
43 45 68 55:5;
n 10
i1
n
X 2
x i x 2062:5;
i1
n
X
x i x
y i y 1182:5:
i 1
The substitution of these values into Equations (11.7) and (11.8) gives
1182:5
^
0:57;
2062:5
^ 55:5 0:57
67:5 17:03:
The estimated regression line together with observed sample values is shown
in Figure 11.2.
It is noteworthy that regression relationships are valid only for the range
of x values represented by the data. Thus, the estimated regression line in
Example 11.1 holds only for temperatures between 45 Cand 90 C. Extrapolation
of the result beyond this range can be misleading and is not valid in general.
Another word of caution has to do with the basic linear assumption between
f g
E Y and x. Linear regression analysis such as the one performed in Example
f g
11.1 is based on the assumption that the true relationship between E Y and
x is linear. Indeed, if the underlying relationship is nonlinear or nonexistent,
TLFeBOOK