
Page 112 - Fundamentals of Radar Signal Processing
P. 112
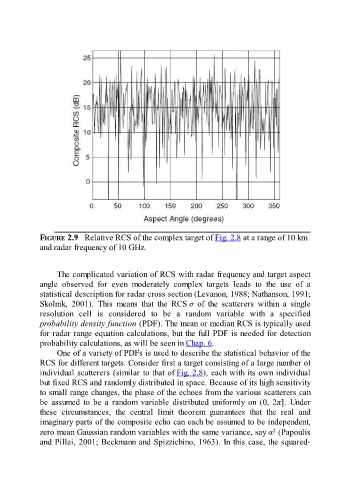
FIGURE 2.9   Relative RCS of the complex target of Fig. 2.8 at a range of 10 km

               and radar frequency of 10 GHz.


                     The complicated variation of RCS with radar frequency and target aspect

               angle  observed  for  even  moderately  complex  targets  leads  to  the  use  of  a
               statistical description for radar cross section (Levanon, 1988; Nathanson, 1991;
               Skolnik,  2001).  This  means  that  the  RCS σ  of  the  scatterers  within  a  single
               resolution  cell  is  considered  to  be  a  random  variable  with  a  specified
               probability density function (PDF). The mean or median RCS is typically used
               for radar range equation calculations, but the full PDF is needed for detection
               probability calculations, as will be seen in Chap. 6.

                     One of a variety of PDFs is used to describe the statistical behavior of the
               RCS for different targets. Consider first a target consisting of a large number of
               individual scatterers (similar to that of Fig. 2.8), each with its own individual
               but fixed RCS and randomly distributed in space. Because of its high sensitivity
               to small range changes, the phase of the echoes from the various scatterers can

               be  assumed  to  be  a  random  variable  distributed  uniformly  on  (0,  2π].  Under
               these  circumstances,  the  central  limit  theorem  guarantees  that  the  real  and
               imaginary parts of the composite echo can each be assumed to be independent,
                                                                                                 2
               zero mean Gaussian random variables with the same variance, say α  (Papoulis
               and Pillai, 2001; Beckmann and Spizzichino, 1963). In this case, the squared-