
Page 115 - Fundamentals of Radar Signal Processing
P. 115
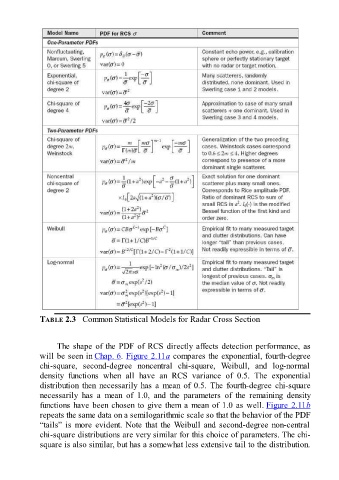
TABLE 2.3   Common Statistical Models for Radar Cross Section


                     The shape of the PDF of RCS directly affects detection performance, as
               will be seen in Chap. 6. Figure 2.11a compares the exponential, fourth-degree

               chi-square,  second-degree  noncentral  chi-square,  Weibull,  and  log-normal
               density  functions  when  all  have  an  RCS  variance  of  0.5.  The  exponential
               distribution  then  necessarily  has  a  mean  of  0.5.  The  fourth-degree  chi-square
               necessarily  has  a  mean  of  1.0,  and  the  parameters  of  the  remaining  density
               functions have been chosen to give them a mean of 1.0 as well. Figure 2.11b
               repeats the same data on a semilogarithmic scale so that the behavior of the PDF
               “tails” is more evident. Note that the Weibull and second-degree non-central

               chi-square distributions are very similar for this choice of parameters. The chi-
               square is also similar, but has a somewhat less extensive tail to the distribution.