
Page 146 - Fundamentals of Radar Signal Processing
P. 146
and noise figure of the receiver system are sufficient to calculate the output
noise power using N = kT β F G . It also follows from using Eq. (2.82) in Eq.
s
0 n n
(2.83) that Te = (F – 1)T . Typical noise figures for radars can be as low as 2
0
n
or 3 dB, and as high as 10 dB or more. Corresponding effective temperatures
range from about 170 K to over 2600 K.
In Sec. 2.2, the term “radar range equation” was applied to Eqs. (2.11),
(2.25), (2.30), and (2.32). These expressions described the echo power
received by the radar given various system and propagation conditions. As will
be seen in Chap. 6, the detection performance of a radar depends not on the
received power per se but on the SNR at the point of detection. Equation (2.83)
can be used to convert the power range equations to SNR range equations.
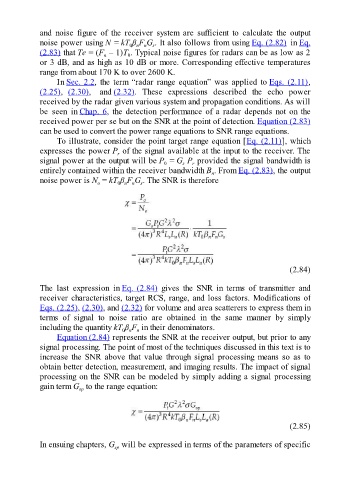
To illustrate, consider the point target range equation [Eq. (2.11)], which
expresses the power P of the signal available at the input to the receiver. The
r
signal power at the output will be P = G P provided the signal bandwidth is
s
r
0
entirely contained within the receiver bandwidth B . From Eq. (2.83), the output
n
noise power is N = kT β F G . The SNR is therefore
s
o
0 n n
(2.84)
The last expression in Eq. (2.84) gives the SNR in terms of transmitter and
receiver characteristics, target RCS, range, and loss factors. Modifications of
Eqs. (2.25), (2.30), and (2.32) for volume and area scatterers to express them in
terms of signal to noise ratio are obtained in the same manner by simply
including the quantity kT β F in their denominators.
0 n n
Equation (2.84) represents the SNR at the receiver output, but prior to any
signal processing. The point of most of the techniques discussed in this text is to
increase the SNR above that value through signal processing means so as to
obtain better detection, measurement, and imaging results. The impact of signal
processing on the SNR can be modeled by simply adding a signal processing
gain term G to the range equation:
sp
(2.85)
In ensuing chapters, G will be expressed in terms of the parameters of specific
sp