
Page 118 - Fundamentals of Reservoir Engineering
P. 118
PVT ANALYSIS FOR OIL 57
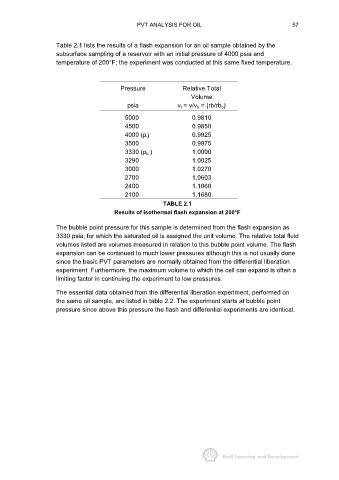
Table 2.1 lists the results of a flash expansion for an oil sample obtained by the
subsurface sampling of a reservoir with an initial pressure of 4000 psia and
temperature of 200°F; the experiment was conducted at this same fixed temperature.
Pressure Relative Total
Volume
psia v t = v/v b = (rb/rb b)
5000 0.9810
4500 0.9850
4000 (p i) 0.9925
3500 0.9975
3330 (p b ) 1.0000
3290 1.0025
3000 1.0270
2700 1.0603
2400 1.1060
2100 1.1680
TABLE 2.1
Results of isothermal flash expansion at 200°F
The bubble point pressure for this sample is determined from the flash expansion as
3330 psia, for which the saturated oil is assigned the unit volume. The relative total fluid
volumes listed are volumes measured in relation to this bubble point volume. The flash
expansion can be continued to much lower pressures although this is not usually done
since the basic PVT parameters are normally obtained from the differential liberation
experiment. Furthermore, the maximum volume to which the cell can expand is often a
limiting factor in continuing the experiment to low pressures.
The essential data obtained from the differential liberation experiment, performed on
the same oil sample, are listed in table 2.2. The experiment starts at bubble point
pressure since above this pressure the flash and differential experiments are identical.