
Page 123 - Fundamentals of Reservoir Engineering
P. 123
PVT ANALYSIS FOR OIL 62
The conclusion reached, from the foregoing description of the effects of surface
separation, is somewhat disturbing since it implies that the volume of equilibrium oil
collected in the stock tank is dependent on the manner in which the oil and gas are
separated. This in turn means that the basic PVT parameters B o and R s which are
measured in terms of volume "per stock tank barrel" must also be dependent on the
manner of surface separation and cannot be assigned absolute values.
The only way to account for the effects of surface separation is to perform a series of
separator tests on oil samples as part of the basic PVT analysis, and combine the
results of these tests with differential liberation data. Samples of oil are put in the PV
cell, fig. 2.8, and raised to reservoir temperature and bubble point pressure. The cell is
connected to a single or multi-stage model separator system, with each separator at a
fixed pressure and temperature. The bubble point oil is then flashed through the
separator system to stock tank conditions and the resulting volumes of oil and gas are
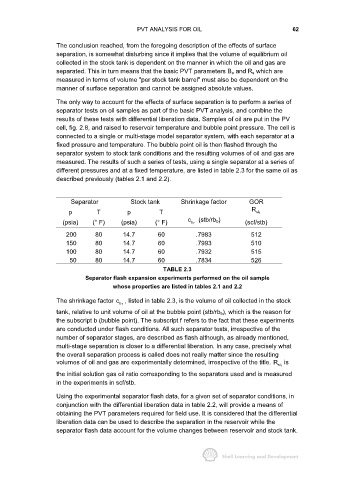
measured. The results of such a series of tests, using a single separator at a series of
different pressures and at a fixed temperature, are listed in table 2.3 for the same oil as
described previously (tables 2.1 and 2.2).
Separator Stock tank Shrinkage factor GOR
p T p T R si f
(psia) (° F) (psia) (° F) c (stb/rb b) (scf/stb)
f b
200 80 14.7 60 .7983 512
150 80 14.7 60 .7993 510
100 80 14.7 60 .7932 515
50 80 14.7 60 .7834 526
TABLE 2.3
Separator flash expansion experiments performed on the oil sample
whose properties are listed in tables 2.1 and 2.2
The shrinkage factor c , listed in table 2.3, is the volume of oil collected in the stock
f b
tank, relative to unit volume of oil at the bubble point (stb/rb b), which is the reason for
the subscript b (bubble point). The subscript f refers to the fact that these experiments
are conducted under flash conditions. All such separator tests, irrespective of the
number of separator stages, are described as flash although, as already mentioned,
multi-stage separation is closer to a differential liberation. In any case, precisely what
the overall separation process is called does not really matter since the resulting
volumes of oil and gas are experimentally determined, irrespective of the title. R is
si
f
the initial solution gas oil ratio corresponding to the separators used and is measured
in the experiments in scf/stb.
Using the experimental separator flash data, for a given set of separator conditions, in
conjunction with the differential liberation data in table 2.2, will provide a means of
obtaining the PVT parameters required for field use. It is considered that the differential
liberation data can be used to describe the separation in the reservoir while the
separator flash data account for the volume changes between reservoir and stock tank.