Page 125 - Fundamentals of Reservoir Engineering
P. 125

PVT ANALYSIS FOR OIL                                   64

                     EXERCISE 2.2 SOLUTION

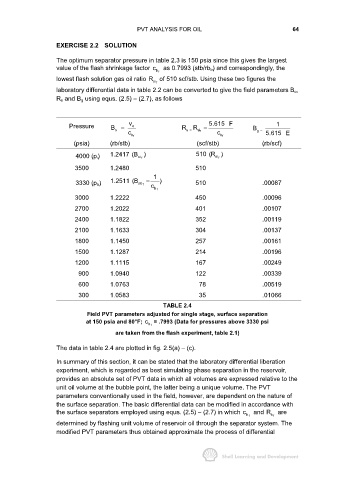
                     The optimum separator pressure in table 2.3 is 150 psia since this gives the largest
                     value of the flash shrinkage factor c  as 0.7993 (stb/rb b) and correspondingly, the
                                                         f b
                     lowest flash solution gas oil ratio R of 510 scf/stb. Using these two figures the
                                                       si
                                                        f
                     laboratory differential data in table 2.2 can be converted to give the field parameters B o,
                     R s and B g using equs. (2.5) − (2.7), as follows


                         Pressure       B =   v o                R   R −  5.615 F         B       1
                                         o
                                              c                   s =  f si  c             g =  5.615 E
                                                f b                            f b
                           (psia)       (rb/stb)                      (scf/stb)              (rb/scf)
                            4000 (p i)  1.2417 (B )                   510 (R )
                                                                             si
                                                 oi
                                                                              f
                                                   f
                           3500         1.2480                        510
                                                       1
                            3330 (p b)  1.2511 (B ob f  = c  )        510                    .00087
                                                        f b
                           3000         1.2222                        450                    .00096

                           2700         1.2022                        401                    .00107
                           2400         1.1822                        352                    .00119

                           2100         1.1633                        304                    .00137
                           1800         1.1450                        257                    .00161
                           1500         1.1287                        214                    .00196

                           1200         1.1115                        167                    .00249
                             900        1.0940                        122                    .00339

                             600        1.0763                         78                    .00519
                             300        1.0583                         35                    .01066
                                                          TABLE 2.4
                                Field PVT parameters adjusted for single stage, surface separation
                               at 150 psia and 80°F;  c  = .7993 (Data for pressures above 3330 psi
                                                      f b
                                          are taken from the flash experiment, table 2.1)


                     The data in table 2.4 are plotted in fig. 2.5(a) − (c).
                     In summary of this section, it can be stated that the laboratory differential liberation
                     experiment, which is regarded as best simulating phase separation in the reservoir,
                     provides an absolute set of PVT data in which all volumes are expressed relative to the
                     unit oil volume at the bubble point, the latter being a unique volume. The PVT
                     parameters conventionally used in the field, however, are dependent on the nature of
                     the surface separation. The basic differential data can be modified in accordance with
                     the surface separators employed using equs. (2.5) − (2.7) in which c  and R  are
                                                                                        f b      f b
                     determined by flashing unit volume of reservoir oil through the separator system. The
                     modified PVT parameters thus obtained approximate the process of differential
   120   121   122   123   124   125   126   127   128   129   130