
Page 180 - Fundamentals of Reservoir Engineering
P. 180
DARCY'S LAW AND APPLICATIONS 118
and results from defining k in equ. (4.8) as the permeability, rather than the K in
equ. (4.3), the latter having a dependence on the fluid properties. The permeability so
defined is termed the absolute permeability.
If there are two fluids, such as oil and water, flowing simultaneously through a porous
medium, then each fluid has its own, so-called, effective permeability. These
permeabilities are dependent on the saturations of each fluid and the sum of the
effective permeabilities is always less than the absolute permeability. The saturation
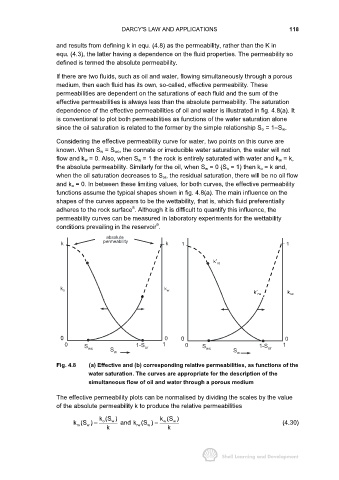
dependence of the effective permeabilities of oil and water is illustrated in fig. 4.8(a). It
is conventional to plot both permeabilities as functions of the water saturation alone
since the oil saturation is related to the former by the simple relationship S o = 1−S w.
Considering the effective permeability curve for water, two points on this curve are
known. When S w = S wc, the connate or irreducible water saturation, the water will not
flow and k w = 0. Also, when S w = 1 the rock is entirely saturated with water and k w = k,
the absolute permeability. Similarly for the oil, when S w = 0 (S o = 1) then k o = k and,
when the oil saturation decreases to S or, the residual saturation, there will be no oil flow
and k o = 0. In between these limiting values, for both curves, the effective permeability
functions assume the typical shapes shown in fig. 4.8(a). The main influence on the
shapes of the curves appears to be the wettability, that is, which fluid preferentially
8
adheres to the rock surface . Although it is difficult to quantify this influence, the
permeability curves can be measured in laboratory experiments for the wettability
9
conditions prevailing in the reservoir .
absolute
k permeability k 1 1
k′ ro
k o k w
k′ rw k rw
0 0 0 0 0 0
0 S wc S w 1-S or 1 0 S wc S w 1-S or 1
Fig. 4.8 (a) Effective and (b) corresponding relative permeabilities, as functions of the
water saturation. The curves are appropriate for the description of the
simultaneous flow of oil and water through a porous medium
The effective permeability plots can be normalised by dividing the scales by the value
of the absolute permeability k to produce the relative permeabilities
k(S ) k(S )
k(S ) = o w and k (S ) = w w (4.30)
ro
w
k rw w k