Page 181 - Fundamentals of Reservoir Engineering
P. 181

DARCY'S LAW AND APPLICATIONS                               119

                     The plots of k ro and k rw, corresponding to the effective permeability plots of fig. 4.8(a),
                     are drawn in fig. 4.8(b). Both sets of curves have precisely the same shape, the only
                     difference being that the relative permeability scales have the range zero to unity.
                     Relative permeabilities are used as a mathematical convenience since in a great many
                     displacement calculations the ratio of effective permeabilities appears in the equations,
                     which can be simplified as the ratio of
                           k (S )     k k (S )      k (S )
                                       ×
                                                     ro
                                             w
                               w
                            o
                                          ro
                                                        w
                           k(S )   =  k k (S )   =  k (S )
                                       ×
                            w   w        rw   w      rw  w
                     In figs. 4.8(a) and (b) the parts of the curves for water saturations below S w = S wc and
                     above S w = 1 - S or are drawn as dashed lines because, although these sections of the
                     plots can be determined in laboratory experiments, they will never be encountered in
                     fluid displacement in the reservoir, since the practical range of water saturations is
                           S wc ≤ S w ≤ 1—S or

                     The maximum relative permeabilities to oil and water that can naturally occur during
                     displacement are called the end-point relative permeabilities and defined as
                     (fig. 4.8(b)),

                           k′ =  k (at S =  S )
                                            wc
                                 ro
                                       w
                            ro
                     and
                           k′ =  k (at S = 1 S )                                                    (4.31)
                                            −
                                               or
                            rw
                                       w
                                 rw
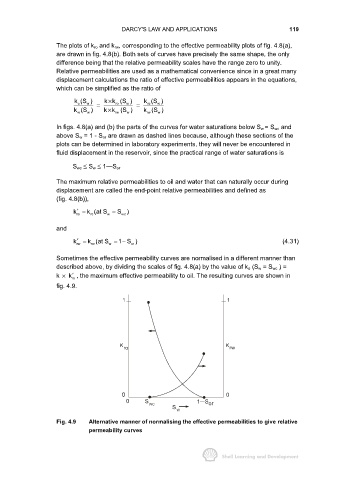
                     Sometimes the effective permeability curves are normalised in a different manner than
                     described above, by dividing the scales of fig. 4.8(a) by the value of k o (S w = S wc ) =
                     k   k′ , the maximum effective permeability to oil. The resulting curves are shown in
                          ro
                     fig. 4.9.

                                            1                                    1


                                           K ro                                 K rw


                                            0 0                                 0
                                             0      S                 1   S
                                                     WC                   or
                                                             S
                                                               W
                     Fig. 4.9   Alternative manner of normalising the effective permeabilities to give relative
                                permeability curves
   176   177   178   179   180   181   182   183   184   185   186