
Page 109 - Gas Purification 5E
P. 109
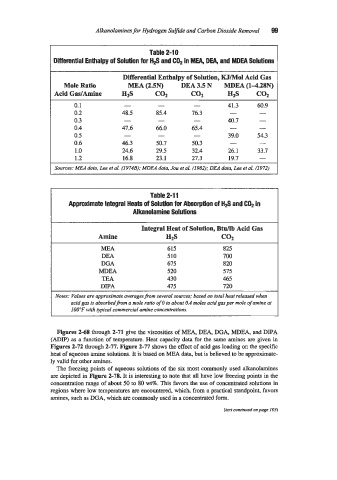
Alkanolamines for Hydrogen Sulfide and Carbon Dioxide Removal   99


                                             Table 2-1 0
                 Differential Enthalpy of Solution for tl#  and C02 in MEA, DEA, and MDEA Solutions


                                     Differential Enthalpy of Solution, KJ/Mol Acid Gas
                    Mole Ratio         MEA (2.5N)      DEA 3.5 N   MDEA (1428N)
                 Acid GadAmine       H2S       co2       COZ        HIS      cot
                       0.1            -         -         -         41.3     60.9
                       0.2           48.5      85.4       76.3       -        -
                       0.3            -         -         -         40.7      -
                       0.4           47.6      66.0       65.4       -        -
                       0.5            -         -         -         39.0     54.3
                       0.6           46.3      50.7       50.3       -        -
                       1 .o          24.6      29.5       32.4      26.1     33.7
                       1.2           16.8      23.1       27.3       19.7     -
                 Sources: MEA data, Lee et al. (I974B); MDE4 data, Jou et al. (1982); DEA data, Lee et al. 11972)


                                             Table 2-11
                     Approximate Integral Heats of Solution for Absorption of Hfi  and C02 in
                                        Alkanolamine Solutions

                                           Integral Heat of Solution, Btdb Acid Gas
                              Amine               H2S             co2
                               MEA                615              825
                               DEA                510              700
                               DGA                675              820
                              MDEA                520              575
                               TEA                430              465
                               DIPA               475              720
                 Notes: Values are approximate averagesfrorn several sowces; based on total heat released when
                      acid gas is absorbedj-om a mole ratio of 0 to about 0.4 moles acid gas per mole of amine at
                      100°F with typical commercial amine concentrations.


                  Figures 2-68 through 2-71 give the viscosities of MEA, DEA, DGA, MDEA, and DIPA
                (ADP) as a function of  temperature. Heat capacity data for the same amines are given in
                Figures 2-72 through 2-77.  Figure 2-77 shows the effect of acid gas loading OI? the specific
                heat of aqueous amine solutions. It is based on MEA data, but is believed to be approximate-
                ly valid for other amines.
                  The freezing points of  aqueous solutions of  the six most commonly used ahnolamines
                are depicted in Figure 2-78.  It is interesting to note that all have low freezing points in the
                concentration range of about 50 to 80 wt%. This favors the use of concentrated solutions in
                regions where low temperatures are encountered, which, from a practical standpoint, favors
                amines, such as DGA, which are commonly used in a concentrated form.
                                                                   (rat conrinued on page I03j