
Page 110 - Gas Adsorption Equilibria
P. 110
96 Chapter 2
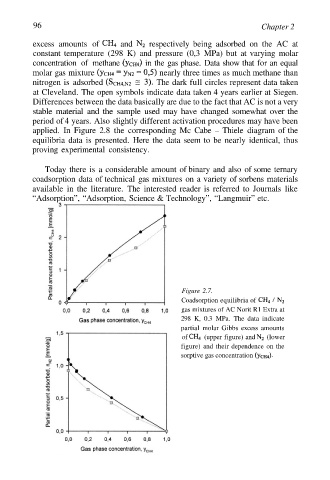
excess amounts of and respectively being adsorbed on the AC at
constant temperature (298 K) and pressure (0,3 MPa) but at varying molar
concentration of methane in the gas phase. Data show that for an equal
molar gas mixture nearly three times as much methane than
nitrogen is adsorbed The dark full circles represent data taken
at Cleveland. The open symbols indicate data taken 4 years earlier at Siegen.
Differences between the data basically are due to the fact that AC is not a very
stable material and the sample used may have changed somewhat over the
period of 4 years. Also slightly different activation procedures may have been
applied. In Figure 2.8 the corresponding Mc Cabe – Thiele diagram of the
equilibria data is presented. Here the data seem to be nearly identical, thus
proving experimental consistency.
Today there is a considerable amount of binary and also of some ternary
coadsorption data of technical gas mixtures on a variety of sorbens materials
available in the literature. The interested reader is referred to Journals like
“Adsorption”, “Adsorption, Science & Technology”, “Langmuir” etc.
Figure 2.7.
Coadsorption equilibria of
gas mixtures of AC Norit R1 Extra at
298 K, 0.3 MPa. The data indicate
partial molar Gibbs excess amounts
of (upper figure) and (lower
figure) and their dependence on the
sorptive gas concentration