Page 24 - gas transport in porous media
P. 24

Chapter 2: Gas Transport Mechanisms
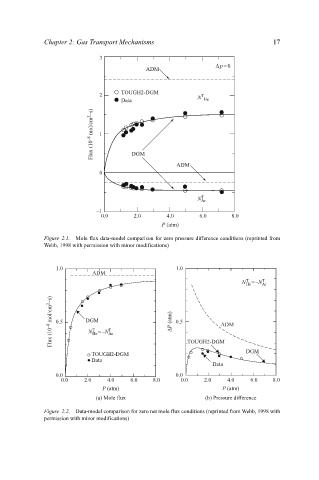
                                           3
                                                                            ∆p =0           17
                                                        ADM
                                                 TOUGH2-DGM
                                           2                            T
                                                 Data                  N He
                                         Flux (10 –8  mol/cm 2 –s)  1


                                                    DGM
                                                                 ADM
                                           0


                                                                        T
                                                                       N Ar
                                          –1
                                           0.0       2.0      4.0      6.0      8.0
                                                            P (atm)
                           Figure 2.1.  Mole flux data-model comparison for zero pressure difference conditions (reprinted from
                           Webb, 1998 with permission with minor modifications)


                              1.0                               1.0
                                         ADM
                                                                                    T    T
                                                                                   N He =–N Ar
                             Flux (10 –8  mol/cm 2 –s)  0.5  DGM  T  ∆P (atm)  0.5  ADM


                                         T
                                        N He =–N Ar
                                                                    TOUGH2-DGM
                                                                                    DGM
                                         TOUGH2-DGM
                                         Data
                                                                           Data
                              0.0                               0.0
                                0.0    2.0   4.0    6.0   8.0     0.0    2.0   4.0    6.0   8.0
                                            P (atm)                           P (atm)
                                          (a) Mole flux                  (b) Pressure difference

                           Figure 2.2.  Data-model comparison for zero net mole flux conditions (reprinted from Webb, 1998 with
                           permission with minor modifications)
   19   20   21   22   23   24   25   26   27   28   29