Page 26 - gas transport in porous media
P. 26

Chapter 2: Gas Transport Mechanisms
                               4.00
                               3.50             P ave  = 1.96 atm  4.00           P ave  = 1.96 atm 19
                                                                 3.50
                                                    Data                              Data
                               3.00                 ADM          3.00                 DGM
                               2.50                    N T He    2.50
                             Flux (10 –8  mol/cm 2 –s)  1.50  N T  Flux (10 –8  mol/cm 2 –s)  1.50  N He
                                                                 2.00
                               2.00
                                                                                      T
                                                                 1.00
                               1.00
                                                                 0.50
                               0.50
                              –0.00                             –0.00                 N T
                              –0.50                             –0.50
                              –1.00           T                 –1.00             T
                                             N Ar
                                                                                 N Ar
                              –1.50                             –1.50
                                –0.3 –0.2 –0.1  0.0 0.1 0.2 0.3 0.4  –0.3 –0.2 –0.1  0.0 0.1 0.2 0.3 0.4
                                            ∆ P (atm)                         ∆P (atm)
                                            (a) ADM                           (b) DGM

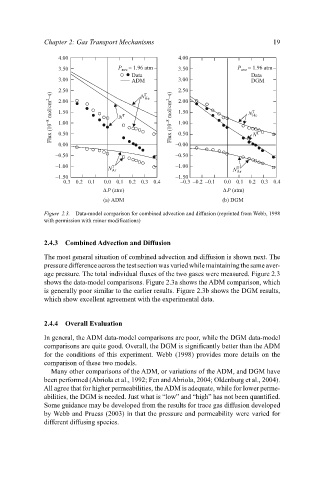
                           Figure 2.3.  Data-model comparison for combined advection and diffusion (reprinted from Webb, 1998
                           with permission with minor modifications)


                           2.4.3  Combined Advection and Diffusion
                           The most general situation of combined advection and diffusion is shown next. The
                           pressure difference across the test section was varied while maintaining the same aver-
                           age pressure. The total individual fluxes of the two gases were measured. Figure 2.3
                           shows the data-model comparisons. Figure 2.3a shows the ADM comparison, which
                           is generally poor similar to the earlier results. Figure 2.3b shows the DGM results,
                           which show excellent agreement with the experimental data.


                           2.4.4  Overall Evaluation

                           In general, the ADM data-model comparisons are poor, while the DGM data-model
                           comparisons are quite good. Overall, the DGM is significantly better than the ADM
                           for the conditions of this experiment. Webb (1998) provides more details on the
                           comparison of these two models.
                             Many other comparisons of the ADM, or variations of the ADM, and DGM have
                           been performed (Abriola et al., 1992; Fen andAbriola, 2004; Oldenburg et al., 2004).
                           All agree that for higher permeabilities, theADM is adequate, while for lower perme-
                           abilities, the DGM is needed. Just what is “low” and “high” has not been quantified.
                           Some guidance may be developed from the results for trace gas diffusion developed
                           by Webb and Pruess (2003) in that the pressure and permeability were varied for
                           different diffusing species.
   21   22   23   24   25   26   27   28   29   30   31