
Page 131 - Geochemistry of Oil Field Waters
P. 131
OTHER METHODS 119
Buffer solution: 67.5 g NH4C1, 570 ml NH40H made to 1 liter with
distilled water.
Procedure:
(1) Determine the pH of the returned water. If pH is below 4, the
presence of HC1 is indicated.
(2) Pour 10-15 ml of the sample into a beaker containing 10 g of
10-mesh CaC03. Bring to a boil, remove from the hotplate, allow to settle
for about 5 minutes, and filter.
(3) Pipet 1.0 ml of the filtrate into a beaker containing 50 ml of HZO.
Heat to boiling, add 1 ml NH40H while stirring, remove from heat, let settle
for a few minutes, and filter through Whatman No.31 paper. Wash the
beaker and filter twice, using 25.0 ml H2 0 for each wash.
(4) Add 0.5 g Eriochrome Black T indicator to the filtrate and 10 ml of
the buffer solution (pH should be 10). Titrate with standard CDTA solution
(1 ml = 9.0 mg Ca) to a permanent clear blue endpoint. Record the milliliters
of CDTA used. Refer to a curve to determine the percent spent acid in the
sample.
(5) To determine a blank, take 1.0 ml of the formation water through the
procedure, starting at step 3 and determine 0% spent acid, or the blank
correction.
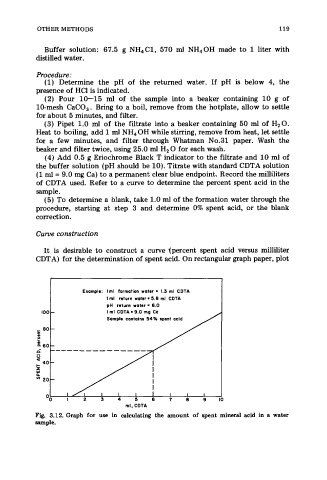
Curve construction
It is desirable to construct a curve tpercent spent acid versus milliliter
CDTA) for the determination of spent acid. On rectangular graph paper, plot
Example: Iml formation water = 1.3 ml CDTA
I ml return water = 5.8 ml CDTA
100 - pH refwn woter = 6.0
I ml CDTA = 9.0 mg Ca
I
Fig. 3.12. Graph for use in calculating the amount of spent mineral acid in a water
sample.