
Page 32 - Geochemistry of Oil Field Waters
P. 32
QTJALITY CONTROL 21
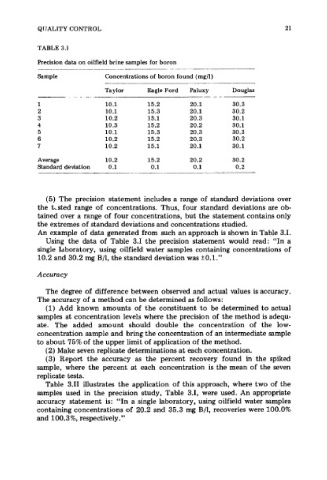
TABLE 3.1
Precision data on oilfield brine samples for boron
___
~~
Sample Concentrations of boron found (mg/l)
Taylor Eagle Ford Paluxy Douglas
-- . - ____ - -
10.1 15.2 20.1 30.3
10.1 15.3 20.1 30.2
10.2 15.1 20.3 30.1
10.3 15.2 20.2 30.1
10.1 15.3 20.3 30.3
10.2 15.2 20.3 30.2
10.2 15.1 20.1 30.1
Average 10.2 15.2 20.2 30.2
Standard deviation 0.1 0.1 0.1 0.2
(5) The precision statement includes a range of standard deviations over
the tAed range of concentrations. Thus, four standard deviations are ob-
tained over a range of four concentrations, but the statement contains only
the extremes of standard deviations and concentrations studied.
An example of data generated from such an approach is shown in Table 3.1.
Using the data of Table 3.1 the precision statement would read: “In a
single ldboratory, using oilfield water samples containing concentrations of
10.2 and 30.2 mg B/1, the standard deviation was kO.1.”
Accuracy
The degree of difference between observed and actual values is accuracy.
The accuracy of a method can be determined as follows:
(1) Add known amounts of the constituent to be determined to actual
samples at concentration levels where the precision of the method is adequ-
ate. The added amount should double the concentration of the low-
concentration sample and bring the concentration of an intermediate sample
to about 75% of the upper limit of application of the method.
(2) Make seven replicate determinations at each concentration.
(3) Report the accuracy as the percent recovery found in the spiked
sample, where the percent at each concentration is the mean of the seven
replicate tests.
Table 3.11 illustrates the application of this approach, where two of the
samples used in the precision study, Table 3.1, were used. An appropriate
accuracy statement is: “In a single laboratory, using oilfield water samples
containing concentrations of 20.2 and 35.3 mg B/1, recoveries were 100.0%
and 100.3%, respectively.”