
Page 68 - Geochemistry of Oil Field Waters
P. 68
56 ANALYSIS OF OILFIELD WATERS
5
4
v)
13
r
23
W
a
0 L
c
a
.x2
I
u
2s
1
I
I
5
I I 3 I 4 I 6 7
COI t ENTRATION OF STANDARD - ADDITIONS
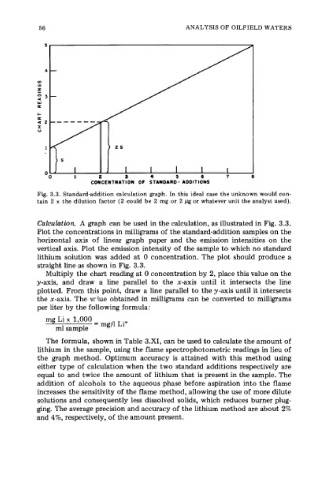
Fig. 3.3. Standard-addition calculation graph. In this ideal case the unknown would con-
tain 2 x the dilution factor (2 could be 2 mg or 2 pg or whatever unit the analyst used).
Calculation. A graph can be used in the calculation, as illustrated in Fig. 3.3.
Plot the concentrations in milligrams of the standard-addition samples on the
horizontal axis of linear graph paper and the emission intensities on the
vertical axis. Plot the emission intensity of the sample to which no standard
lithium soiution was added at 0 concentration. The plot should produce a
straight line as shown in Fig. 3.3.
Multiply the chart reading at 0 concentration by 2, place this value on the
y-axis, and draw a line parallel to the x-axis until it intersects the line
plotted. From this point, draw a line parallel to the y-axis until it intersects
the x-axis. The vrlue obtained in milligrams can be converted to milligrams
per liter by the following formula:
mg Li x 1,000 = mg/l Li+
ml sample
The formula, shown in Table 3.X1, can be used to calculate the amount of
lithium in the sample, using the flame spectrophotometric readings in lieu of
the graph method. Optimum accuracy is attained with this method using
either type of calculation when the two standard additions respectively are
equal to and twice the amount of lithium that is present in the sample. The
addition of alcohols to the aqueous phase before aspiration into the flame
increases the sensitivity of the flame method, allowing the use of more dilute
solutions and consequently less dissolved solids, which reduces burner plug-
ging. The average precision and accuracy of the lithium method are about 2%
and 4%, respectively, of the amount present.