
Page 106 - Geology of Carbonate Reservoirs
P. 106
CORRELATION 87
the absolute age of the rocks from radioactive isotopes. Correlations based on rela-
tive geological time may be made more precise when it is possible to identify wide-
spread features that represent “ instantaneous ” events such as ash beds and lava
flows. Beds that appear in the same order within a depositional sequence can be
correlated without the aid of fossils or absolute age dates. The Triassic Period, for
example, takes its name from three distinctive rock units that always appear in the
same order over much of Europe north of the Alps, particularly in Germany. A
bright red sandstone called the Bunter is always overlain by shelly limestone called
the Muschelkalk, which is always overlain by variegated shales and salt beds called
the Keuper. The principle that enables correlation of Triassic beds over hundreds
of square kilometers in Europe can be applied to bed sequences of any age at any
location provided that the order of appearance of the beds remains constant in the
sequence.
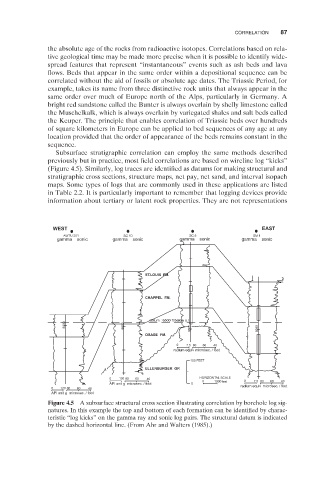
Subsurface stratigraphic correlation can employ the same methods described
previously but in practice, most fi eld correlations are based on wireline log “ kicks ”
(Figure 4.5 ). Similarly, log traces are identified as datums for making structural and
stratigraphic cross sections, structure maps, net pay, net sand, and interval isopach
maps. Some types of logs that are commonly used in these applications are listed
in Table 2.2 . It is particularly important to remember that logging devices provide
information about tertiary or latent rock properties. They are not representations
WEST EAST
AWTU 201 SC 1D SC 5 SM 1
gamma sonic gamma sonic gamma sonic gamma sonic
ST.LOUIS FM.
CHAPPEL FM.
datum : 6500 ft below s.l.
8000 8000 8000 8000
OSAGE FM.
0 7.5 80 60 40
radium equlv microsec. / foot
100 FEET
ELLENBURGER GP.
0 100 80 60 40 HORIZONTAL SCALE
0 1000 feet 0 7.5 80 60 40
API unit g microsec. / foot 0
0 120 80 60 40 radium equlv microsec. / foot
API unit g microsec. / foot
Figure 4.5 A subsurface structural cross section illustrating correlation by borehole log sig-
natures. In this example the top and bottom of each formation can be identified by charac-
teristic “ log kicks ” on the gamma ray and sonic log pairs. The structural datum is indicated
by the dashed horizontal line. (From Ahr and Walters (1985) .)