
Page 151 - Geology of Carbonate Reservoirs
P. 151
132 DEPOSITIONAL CARBONATE RESERVOIRS
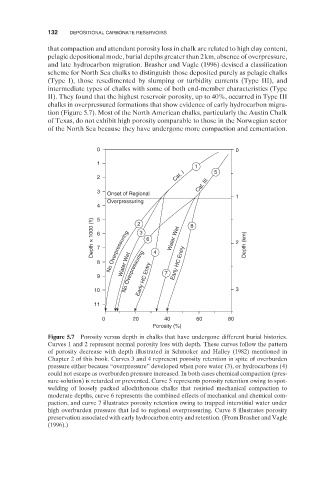
that compaction and attendant porosity loss in chalk are related to high clay content,
pelagic depositional mode, burial depths greater than 2 km, absence of overpressure,
and late hydrocarbon migration. Brasher and Vagle (1996) devised a classifi cation
scheme for North Sea chalks to distinguish those deposited purely as pelagic chalks
(Type I), those resedimented by slumping or turbidity currents (Type III), and
intermediate types of chalks with some of both end - member characteristics (Type
II). They found that the highest reservoir porosity, up to 40%, occurred in Type III
chalks in overpressured formations that show evidence of early hydrocarbon migra-
tion (Figure 5.7 ). Most of the North American chalks, particularly the Austin Chalk
of Texas, do not exhibit high porosity comparable to those in the Norwegian sector
of the North Sea because they have undergone more compaction and cementation.
0 0
1
1
Cat. I 5
2
Cat. III
3 Onset of Regional
1
Overpressuring
4 5
Depth × 1000 (ft) 6 7 2 3 6 Water Wet 8 2 Depth (km)
Water Wet
8 No Overpressuring 4 Early HC Entry
9 No Overpressuring Early HC Entry 7
10 3
11
0 20 40 60 80
Porosity (%)
Figure 5.7 Porosity versus depth in chalks that have undergone different burial histories.
Curves 1 and 2 represent normal porosity loss with depth. These curves follow the pattern
of porosity decrease with depth illustrated in Schmoker and Halley (1982) mentioned in
Chapter 2 of this book. Curves 3 and 4 represent porosity retention in spite of overburden
pressure either because “ overpressure ” developed when pore water (3), or hydrocarbons (4)
could not escape as overburden pressure increased. In both cases chemical compaction (pres-
sure - solution) is retarded or prevented. Curve 5 represents porosity retention owing to spot -
welding of loosely packed allochthonous chalks that resisted mechanical compaction to
moderate depths, curve 6 represents the combined effects of mechanical and chemical com-
paction, and curve 7 illustrates porosity retention owing to trapped interstitial water under
high overburden pressure that led to regional overpressuring. Curve 8 illustrates porosity
preservation associated with early hydrocarbon entry and retention. (From Brasher and Vagle
(1996) .)