
Page 213 - Geology of Carbonate Reservoirs
P. 213
194 FRACTURED RESERVOIRS
6,500
6,400
SHUT-IN PRESSURE (PSIG) 6,200 Slope 1 Slope 2
6,300
6,100
Slope 3
6,000
5,900
5,800
6,700
100,000 10,000 1,000 100 10 1
HORNER TIME (t + Δt)/ Δt
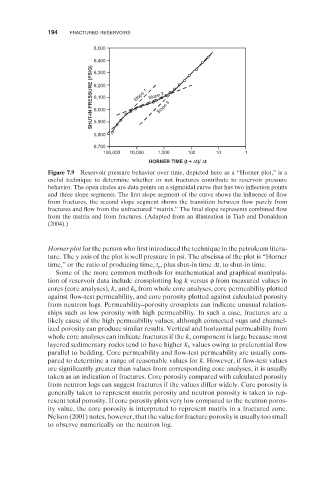
Figure 7.9 Reservoir pressure behavior over time, depicted here as a “ Horner plot, ” is a
useful technique to determine whether or not fractures contribute to reservoir pressure
behavior. The open circles are data points on a sigmoidal curve that has two infl ection points
and three slope segments. The first slope segment of the curve shows the influence of fl ow
from fractures, the second slope segment shows the transition between flow purely from
fractures and flow from the unfractured “ matrix. ” The final slope represents combined fl ow
from the matrix and from fractures. (Adapted from an illustration in Tiab and Donaldson
(2004) .)
Horner plot for the person who first introduced the technique in the petroleum litera-
ture. The y axis of the plot is well pressure in psi. The abscissa of the plot is “ Horner
time, ” or the ratio of producing time, t p , plus shut - in time Δ t , to shut - in time.
Some of the more common methods for mathematical and graphical manipula-
tion of reservoir data include crossplotting log k versus φ from measured values in
cores (core analyses), k v and k h from whole core analyses, core permeability plotted
against flow - test permeability, and core porosity plotted against calculated porosity
from neutron logs. Permeability – porosity crossplots can indicate unusual relation-
ships such as low porosity with high permeability. In such a case, fractures are a
likely cause of the high permeability values, although connected vugs and channel-
ized porosity can produce similar results. Vertical and horizontal permeability from
whole core analyses can indicate fractures if the k v component is large because most
layered sedimentary rocks tend to have higher k h values owing to preferential fl ow
parallel to bedding. Core permeability and flow - test permeability are usually com-
pared to determine a range of reasonable values for k . However, if flow - test values
are significantly greater than values from corresponding core analyses, it is usually
taken as an indication of fractures. Core porosity compared with calculated porosity
from neutron logs can suggest fractures if the values differ widely. Core porosity is
generally taken to represent matrix porosity and neutron porosity is taken to rep-
resent total porosity. If core porosity plots very low compared to the neutron poros-
ity value, the core porosity is interpreted to represent matrix in a fractured zone.
Nelson (2001) notes, however, that the value for fracture porosity is usually too small
to observe numerically on the neutron log.