
Page 86 - Geology of Carbonate Reservoirs
P. 86
CAPILLARY PRESSURE AND RESERVOIR PERFORMANCE 67
CAPILLARY PRESSURE
SATURATION RELATIONS
C
B
Pore Throat Radius (μm) Height (h) in Feet Above Free Water Level Capillary Pressure (P c ) psi Atmospheric A – Entry or Displacement 2σ cos θ P c = r
A
Pressure
B –
Intermediate Pressure
Saturation
Irreducible Wetting
C –
Phase Saturation
C B
A
0 0
0 % Wetting Phase Saturation 100
100 % Nonwetting Phase Saturation 0
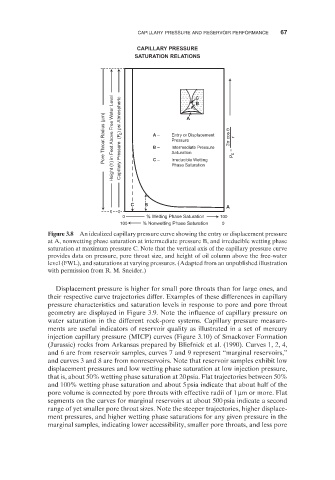
Figure 3.8 An idealized capillary pressure curve showing the entry or displacement pressure
at A, nonwetting phase saturation at intermediate pressure B, and irreducible wetting phase
saturation at maximum pressure C. Note that the vertical axis of the capillary pressure curve
provides data on pressure, pore throat size, and height of oil column above the free - water
level (FWL), and saturations at varying pressures. (Adapted from an unpublished illustration
with permission from R. M. Sneider.)
Displacement pressure is higher for small pore throats than for large ones, and
their respective curve trajectories differ. Examples of these differences in capillary
pressure characteristics and saturation levels in response to pore and pore throat
geometry are displayed in Figure 3.9 . Note the influence of capillary pressure on
water saturation in the different rock - pore systems. Capillary pressure measure-
ments are useful indicators of reservoir quality as illustrated in a set of mercury
injection capillary pressure (MICP) curves (Figure 3.10 ) of Smackover Formation
(Jurassic) rocks from Arkansas prepared by Bliefnick et al. (1990) . Curves 1, 2, 4,
and 6 are from reservoir samples, curves 7 and 9 represent “ marginal reservoirs, ”
and curves 3 and 8 are from nonreservoirs. Note that reservoir samples exhibit low
displacement pressures and low wetting phase saturation at low injection pressure,
that is, about 50% wetting phase saturation at 20 psia. Flat trajectories between 50%
and 100% wetting phase saturation and about 5 psia indicate that about half of the
pore volume is connected by pore throats with effective radii of 1 μ m or more. Flat
segments on the curves for marginal reservoirs at about 500 psia indicate a second
range of yet smaller pore throat sizes. Note the steeper trajectories, higher displace-
ment pressures, and higher wetting phase saturations for any given pressure in the
marginal samples, indicating lower accessibility, smaller pore throats, and less pore