
Page 87 - Geology of Carbonate Reservoirs
P. 87
68 PETROPHYSICAL PROPERTIES OF CARBONATE RESERVOIRS
Rock Type
A B C D E
500 500
Capillary Pressure Height Above Free Water (ft) 250 A B C D E 250 Capillary Pressure Height Above Free Water (ft)
0 0
0 20 40 60 80 100 0
25 Water
Wetting Phase Saturation 50 Saturation
75
(% Pore Volume) 100 (% Pore Volume)
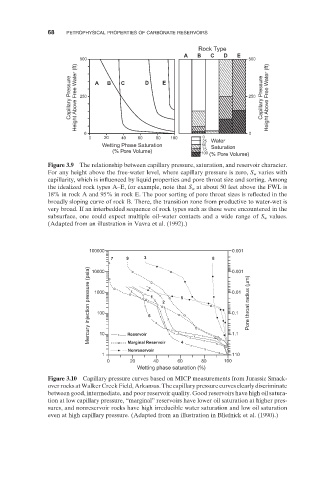
Figure 3.9 The relationship between capillary pressure, saturation, and reservoir character.
For any height above the free - water level, where capillary pressure is zero, S w varies with
capillarity, which is infl uenced by liquid properties and pore throat size and sorting. Among
the idealized rock types A – E, for example, note that S w at about 50 feet above the FWL is
18% in rock A and 95% in rock E. The poor sorting of pore throat sizes is reflected in the
broadly sloping curve of rock B. There, the transition zone from productive to water - wet is
very broad. If an interbedded sequence of rock types such as these were encountered in the
subsurface, one could expect multiple oil – water contacts and a wide range of S w values.
(Adapted from an illustration in Vavra et al. (1992) .)
100000 0.001
7 9 3 8 0.001
Mercury injection pressure (psia) 1000 6 1 2 5 0.01 Pore throat radius (μm)
10000
100
0.1
10
Reservoir
Marginal Reservoir
Nonreservoir 4 1.1
1 110
0 20 40 60 80 100
Wetting phase saturation (%)
Figure 3.10 Capillary pressure curves based on MICP measurements from Jurassic Smack-
over rocks at Walker Creek Field, Arkansas. The capillary pressure curves clearly discriminate
between good, intermediate, and poor reservoir quality. Good reservoirs have high oil satura-
tion at low capillary pressure, “ marginal ” reservoirs have lower oil saturation at higher pres-
sures, and nonreservoir rocks have high irreducible water saturation and low oil saturation
even at high capillary pressure. (Adapted from an illustration in Bliefnick et al. (1990) .)