
Page 21 - Geothermal Energy Renewable Energy and The Environment
P. 21
Introduction 3
In this situation, access to fuel becomes an important factor affecting economic, political, indus-
trial, and social activity. Situations that disturb the free flow of fuel can have important global
impacts. Upheavals in supply of oil and oil prices, for example, such as occurred in the early 1970s
and in 2007, underscore this point.
fuel emissions and environmenTal consideraTions
An additional issue that has taken on importance concerns the environmental impact of fuel extrac-
tion and energy use. There now is little scientific debate that the use of carbon-based fuels for
energy generation has affected the atmosphere and with it the global climate (Solomon et al. 2007).
Carbon-based fuels and human activity produce gases such as carbon dioxide (CO ), oxides of nitro-
2
gen and methane (CH ), among others, all of which affect the ability of the atmosphere to absorb
4
or transmit radiation. As the abundance of these greenhouse gases increases in the atmosphere, the
transmissivity of the atmosphere to thermal energy drops. The result is an increase in the average
surface temperature of the planet. It is precisely this process that has kept the surface of Venus at a
nearly uniform temperatures of 462°C (approximately 736 K or 864°F). The absence of greenhouse
gases is also the reason Mars never gets above 0°C.
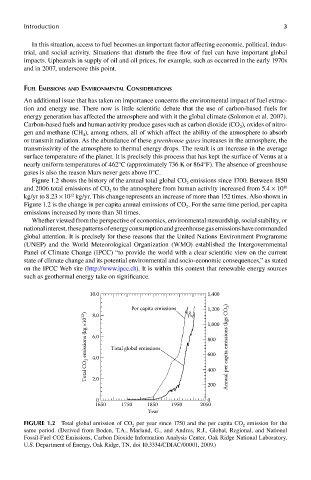
Figure 1.2 shows the history of the annual total global CO emissions since 1700. Between 1850
2
10
and 2006 total emissions of CO to the atmosphere from human activity increased from 5.4 × 10
2
12
kg/yr to 8.23 × 10 kg/yr. This change represents an increase of more than 152 times. Also shown in
Figure 1.2 is the change in per capita annual emissions of CO . For the same time period, per capita
2
emissions increased by more than 30 times.
Whether viewed from the perspective of economics, environmental stewardship, social stability, or
national interest, these patterns of energy consumption and greenhouse gas emissions have commanded
global attention. It is precisely for these reasons that the United Nations Environment Programme
(UNEP) and the World Meteorological Organization (WMO) established the Intergovernmental
Panel of Climate Change (IPCC) “to provide the world with a clear scientific view on the current
state of climate change and its potential environmental and socio-economic consequences,” as stated
on the IPCC Web site (http://www.ipcc.ch). It is within this context that renewable energy sources
such as geothermal energy take on significance.
10.0 1,400
Per capita emissions 1,200
Total CO 2 emissions (kg ×10 12 ) 6.0 Total global emissions 800 Annual per capita emissions (kgs CO 2 )
8.0
1,000
600
4.0
400
2.0
200
0 0
1650 1750 1850 1950 2050
Year
FIGUre 1.2 Total global emission of CO 2 per year since 1750 and the per capita CO 2 emission for the
same period. (Derived from Boden, T.A., Marland, G., and Andres, R.J., Global, Regional, and National
Fossil-Fuel CO2 Emissions, Carbon Dioxide Information Analysis Center, Oak Ridge National Laboratory,
U.S. Department of Energy, Oak Ridge, TN, doi 10.3334/CDIAC/00001, 2009.)