
Page 254 - Geothermal Energy Systems Exploration, Development, and Utilization
P. 254
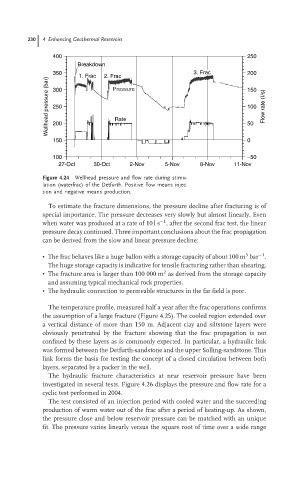
230  4 Enhancing Geothermal Reservoirs
                                  400                                                    250
                                         Breakdown
                                  350    1. Frac  2. Frac                 3. Frac        200
                                 Wellhead pressure (bar)  300  Rate                      150  Flow rate (l/s)
                                                   Pressure


                                                                                         100
                                  250
                                                                                         50
                                  200
                                  150                                                    0

                                  100                                                    −50
                                    27-Oct    30-Oct    2-Nov     5-Nov     8-Nov    11-Nov
                               Figure 4.24  Wellhead pressure and flow rate during stimu-
                               lation (waterfrac) of the Detfurth. Positive flow means injec-
                               tion and negative means production.

                                 To estimate the fracture dimensions, the pressure decline after fracturing is of
                               special importance. The pressure decreases very slowly but almost linearly. Even
                                                                −1
                               when water was produced at a rate of 10 l s , after the second frac test, the linear
                               pressure decay continued. Three important conclusions about the frac propagation
                               can be derived from the slow and linear pressure decline:

                                                                                         3
                                                                                            −1
                               • The frac behaves like a huge ballon with a storage capacity of about 100 m bar .
                                 The huge storage capacity is indicative for tensile fracturing rather than shearing.
                                                                 2
                               • The fracture area is larger than 100 000 m as derived from the storage capacity
                                 and assuming typical mechanical rock properties.
                               • The hydraulic connection to permeable structures in the far field is poor.
                                 The temperature profile, measured half a year after the frac operations confirms
                               the assumption of a large fracture (Figure 4.25). The cooled region extended over
                               a vertical distance of more than 150 m. Adjacent clay and siltstone layers were
                               obviously penetrated by the fracture showing that the frac propagation is not
                               confined by these layers as is commonly expected. In particular, a hydraulic link
                               was formed between the Detfurth-sandstone and the upper Solling-sandstone. This
                               link forms the basis for testing the concept of a closed circulation between both
                               layers, separated by a packer in the well.
                                 The hydraulic fracture characteristics at near reservoir pressure have been
                               investigated in several tests. Figure 4.26 displays the pressure and flow rate for a
                               cyclic test performed in 2004.
                                 The test consisted of an injection period with cooled water and the succeeding
                               production of warm water out of the frac after a period of heating-up. As shown,
                               the pressure close and below reservoir pressure can be matched with an unique
                               fit. The pressure varies linearly versus the square root of time over a wide range