Page 304 - Geothermal Energy Systems Exploration, Development, and Utilization
P. 304

280  5 Geothermal Reservoir Simulation
                                                                           Z
                                  Stimulated reservoir     Fracture network  Y  North
                                  RH11          −2000                 −2000     X East
                                 Borehole locations  RH12  −2050      −2050


                                                       z (Depth below surface) (m)  z (Depth below surface) (m)
                                                −2100
                                                                      −2100
                                  RH15          −2150                 −2150
                                                −2200                 −2200
                                                −2250                 −2250
                                                −2300                 −2300
                                                −2350                 −2350
                                                −2400                 −2400
                                                −2450                 −2450
                                                −2500                 −2500
                                               350
                                                                      350
                                              300
                                                                    300
                                       −400  −375  −350  −325  −400  −375  −350  −325  250
                                            250
                                     x (east) (m)          x (east) (m)
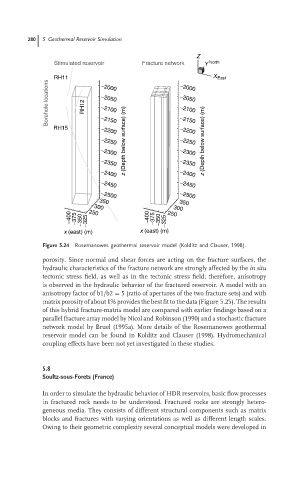
                               Figure 5.24  Rosemanowes geothermal reservoir model (Kolditz and Clauser, 1998).
                               porosity. Since normal and shear forces are acting on the fracture surfaces, the
                               hydraulic characteristics of the fracture network are strongly affected by the in situ
                               tectonic stress field, as well as in the tectonic stress field; therefore, anisotropy
                               is observed in the hydraulic behavior of the fractured reservoir. A model with an
                               anisotropy factor of b1/b2 = 5 (ratio of apertures of the two fracture sets) and with
                               matrix porosity of about 1% provides the best fit to the data (Figure 5.25). The results
                               of this hybrid fracture-matrix model are compared with earlier findings based on a
                               parallel fracture array model by Nicol and Robinson (1990) and a stochastic fracture
                               network model by Bruel (1995a). More details of the Rosemanowes geothermal
                               reservoir model can be found in Kolditz and Clauser (1998). Hydromechanical
                               coupling effects have been not yet investigated in these studies.


                               5.8
                               Soultz-sous-Forets (France)

                               In order to simulate the hydraulic behavior of HDR reservoirs, basic flow processes
                               in fractured rock needs to be understood. Fractured rocks are strongly hetero-
                               geneous media. They consists of different structural components such as matrix
                               blocks and fractures with varying orientations as well as different length scales.
                               Owing to their geometric complexity several conceptual models were developed in
   299   300   301   302   303   304   305   306   307   308   309