
Page 31 - Geothermal Energy Systems Exploration, Development, and Utilization
P. 31
1.1 Expressions of Earth’s Heat Sources 7
Crustal geotherms with varying Q and A
m
1000
1
900
2
800
700 3
Temperature (°C) 500 250 Shallow depths 1
600
400
150
300 200 2 3
100
200 50
0
100
0 2000 4000 6000
0
0 10000 20000 30000 40000 50000
Depth (m)
1 Q = 25 mW m −2 ; A = 3 µW m −3
m
2 Q = 15 mW m −2 ; A = 3 µW m −3
m
3 Q = 40 mW m −2 ; A = 1 µW m −3
m
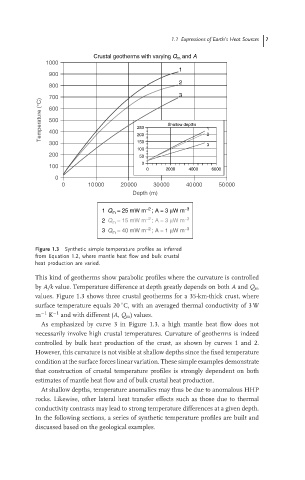
Figure 1.3 Synthetic simple temperature profiles as inferred
from Equation 1.2, where mantle heat flow and bulk crustal
heat production are varied.
This kind of geotherms show parabolic profiles where the curvature is controlled
by A/k value. Temperature difference at depth greatly depends on both A and Q m
values. Figure 1.3 shows three crustal geotherms for a 35-km-thick crust, where
◦
surface temperature equals 20 C, with an averaged thermal conductivity of 3 W
m −1 K −1 and with different (A, Q m )values.
As emphasized by curve 3 in Figure 1.3, a high mantle heat flow does not
necessarily involve high crustal temperatures. Curvature of geotherms is indeed
controlled by bulk heat production of the crust, as shown by curves 1 and 2.
However, this curvature is not visible at shallow depths since the fixed temperature
condition at the surface forces linear variation. These simple examples demonstrate
that construction of crustal temperature profiles is strongly dependent on both
estimates of mantle heat flow and of bulk crustal heat production.
At shallow depths, temperature anomalies may thus be due to anomalous HHP
rocks. Likewise, other lateral heat transfer effects such as those due to thermal
conductivity contrasts may lead to strong temperature differences at a given depth.
In the following sections, a series of synthetic temperature profiles are built and
discussed based on the geological examples.